68
START UP GRAPHS AND TRUMPET CURVES
Chapter 9
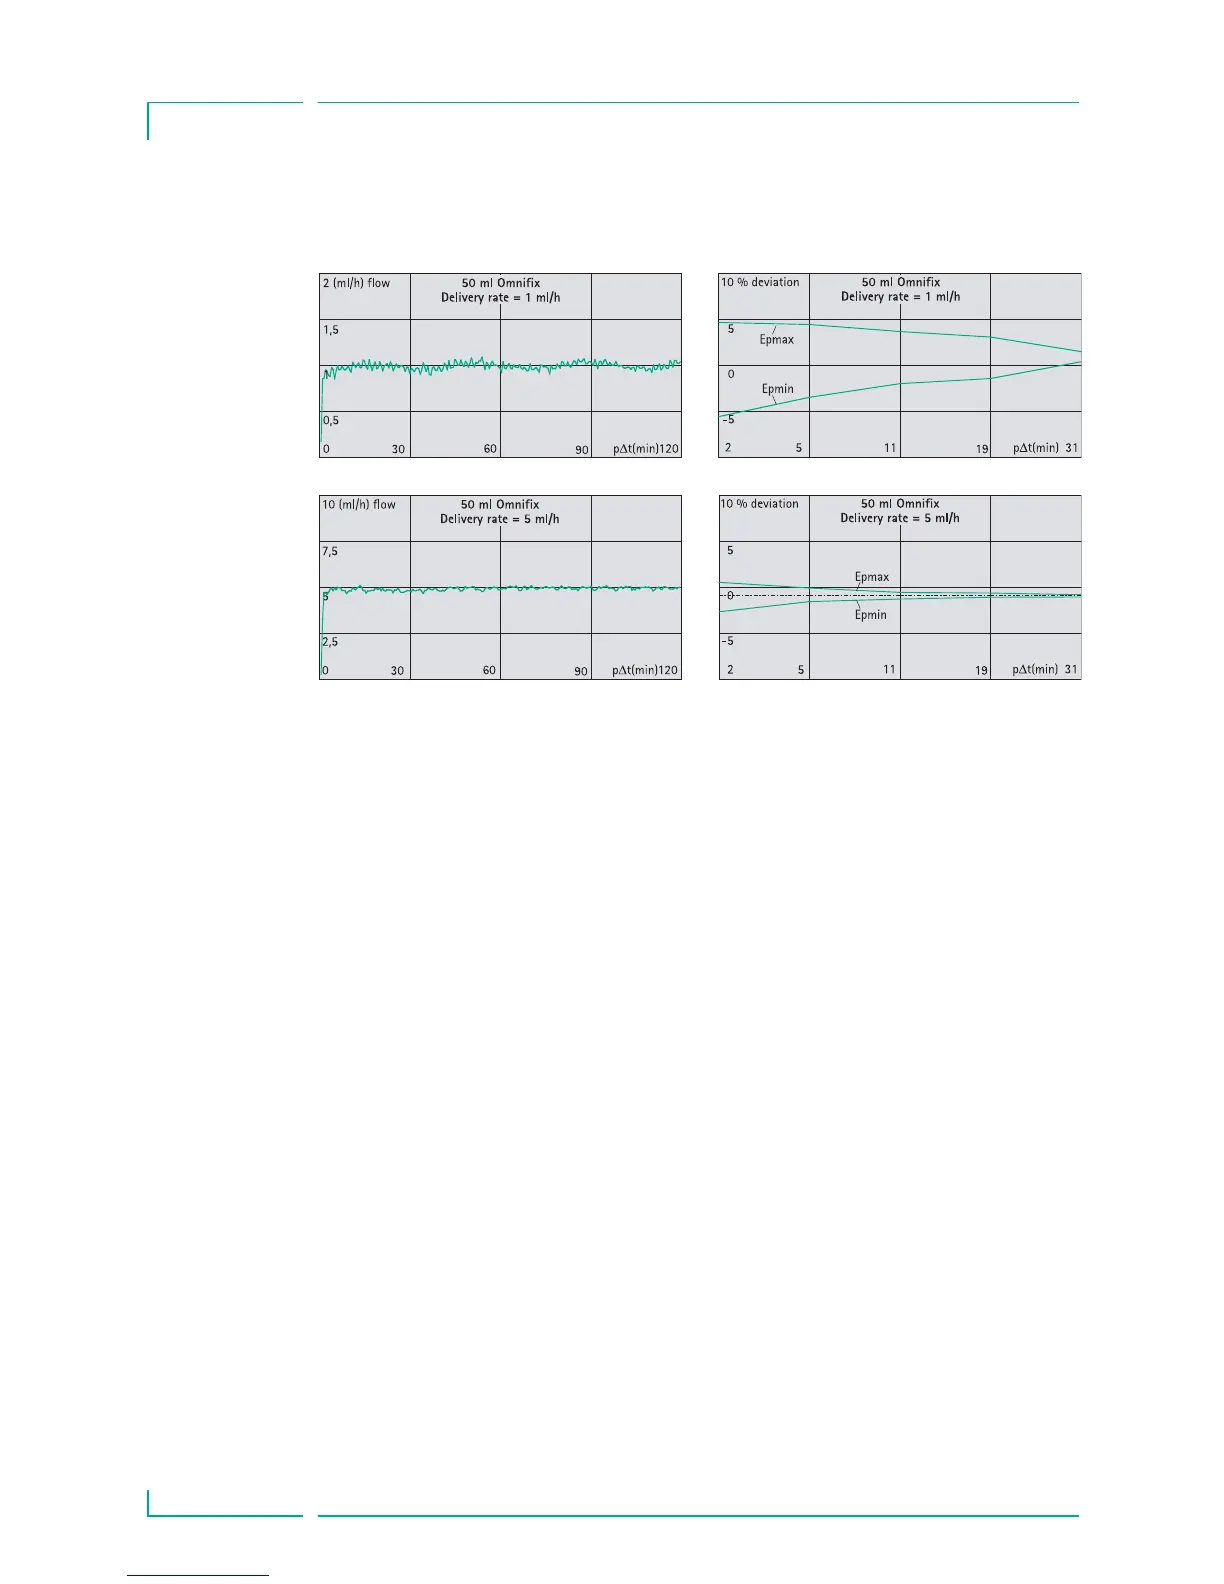
The graphs show the accuracy/uniformity of flow in relation to time. They allow
for the following:
The delivery behaviour or delivery precision is essentially influenced by the type
of (disposable syringe) used. Deviations from the technical data of the pump
cannot be guaranteed as the manufacturer may change syringe specification
significant to system accuracy without prior notification.
System accuracy is ± 2% typical by volume as measured using the trumpet curve
test method defined in IEC 60601-2-24 at rates of 1ml/h (23°C) and when the
pump is used with recommended syringes.
START UP GRAPHS AND TRUMPET CURVES
Trumpet Curves
Measured values for second hour in each case.
Measurement interval ∆t = 0.5 min
Observation interval p x ∆t [min]
Start Up Graphs
Measurement interval ∆t = 0.5 min
Measurement duration T = 120 min
Flow Q
i
(ml/h)
Start Up Curves Trumpet Curves
 Loading...