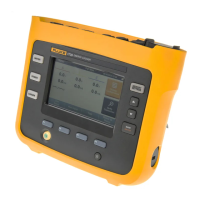
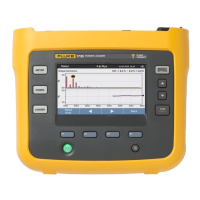
Power Logger
Function Selection Buttons
19
Function Selection Buttons
The Logger has three buttons that toggle between the
Meter, Power, and Logger function modes. The current
mode shows in the upper left corner of the display:
Meter
– The Meter mode shows measurement readings for:
• Voltage (V RMS)
• Current (A RMS)
• Frequency (Hz)
• Wave Shape of Voltage and Current
• THD (%) and Harmonics of Voltage (%, V RMS)
• THD (%) and Harmonics of Current (%, A RMS)
• AUX Input
Push to show the additional values.
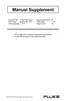
Live Trend
You can determine the values or display a trend chart of
the last 7 minutes. In the chart:
1. Use or the cursor keys to show the list of
available parameters.
2. Push (Reset) to clear the graph and restart.
It is also possible to log the values with the logger function.
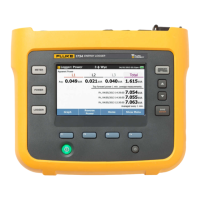
Scope
The scope screen shows about 1.5 periods of voltage and
current. The exact number of shown periods depends on
the input frequency.
The scope screen is helpful to:
• identify the maximum peak value on current channels
as a guide for the selection of the current sensor and
range
• identify the phase sequence of voltage and current
• visually inspect the phase shift between voltage and
current
• understand the consequence of high harmonics on the
signal
Use or the cursor keys to show the list of available
parameters.
Harmonics
Use (Harmonics) to access the harmonics analysis
screens for voltage and current.
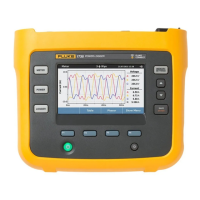
Harmonics Spectrum
The harmonics spectrum is a bar chart of the harmonics
h02 ... h50. When % of the fundamental is selected, THD
is included in the chart. The bar chart in absolute units (V
RMS, A RMS) includes the fundamental. Use the trend
chart to show the exact value.
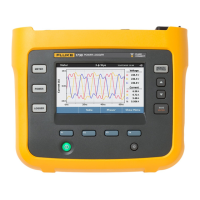
Trend Chart
The trend chart is a chart of the fundamental, a selectable
harmonic, or THD. A split screen shows the harmonics
spectrum in the upper graph and the trend chart in the
lower graph. Touch the bar chart or use and
 Loading...