1736/1738
Users Manual
32
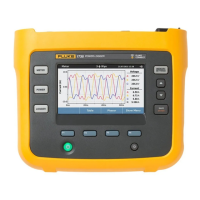
The menu also provides the access to live values of
Energy as:
• Active Energy (E
p
) Wh
• Reactive Energy (E
Q
r) in varh
• Apparent Energy (E
s
) in VAh
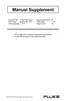
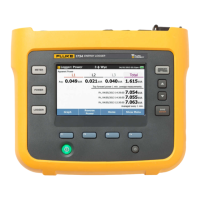
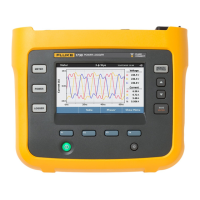
To display a trend chart of the last 7 minutes of Power
values:
1. Push (Live-Trend).
2. Use or the cursor keys to show the list of
available parameters.
3. Push (Reset) to clear the graph and restart.
Note
In the user interface, the term Fundamental is
sometimes shortened to “Fund.” or “h01.”
Logger
– In Logger mode, you can:
• Configure a new logging session
• Review the data of an ongoing logging session in
memory
• Review the data of a completed logging session (as
long as no new session has been started)
Push and then (Logging Sessions) to review a
logging session.
Logging Session Setup
When no logging session is active, push to display the
Setup Summary screen for logging. This screen lists all
logging parameters such as:
• Session name
• Duration and optional recording date and time for
start/stop
• Interval of the average calculation
• Demand interval (not available for load studies)
• Energy costs (not available for load studies)
• Description
 Loading...