241
8 CO/O
2
Control
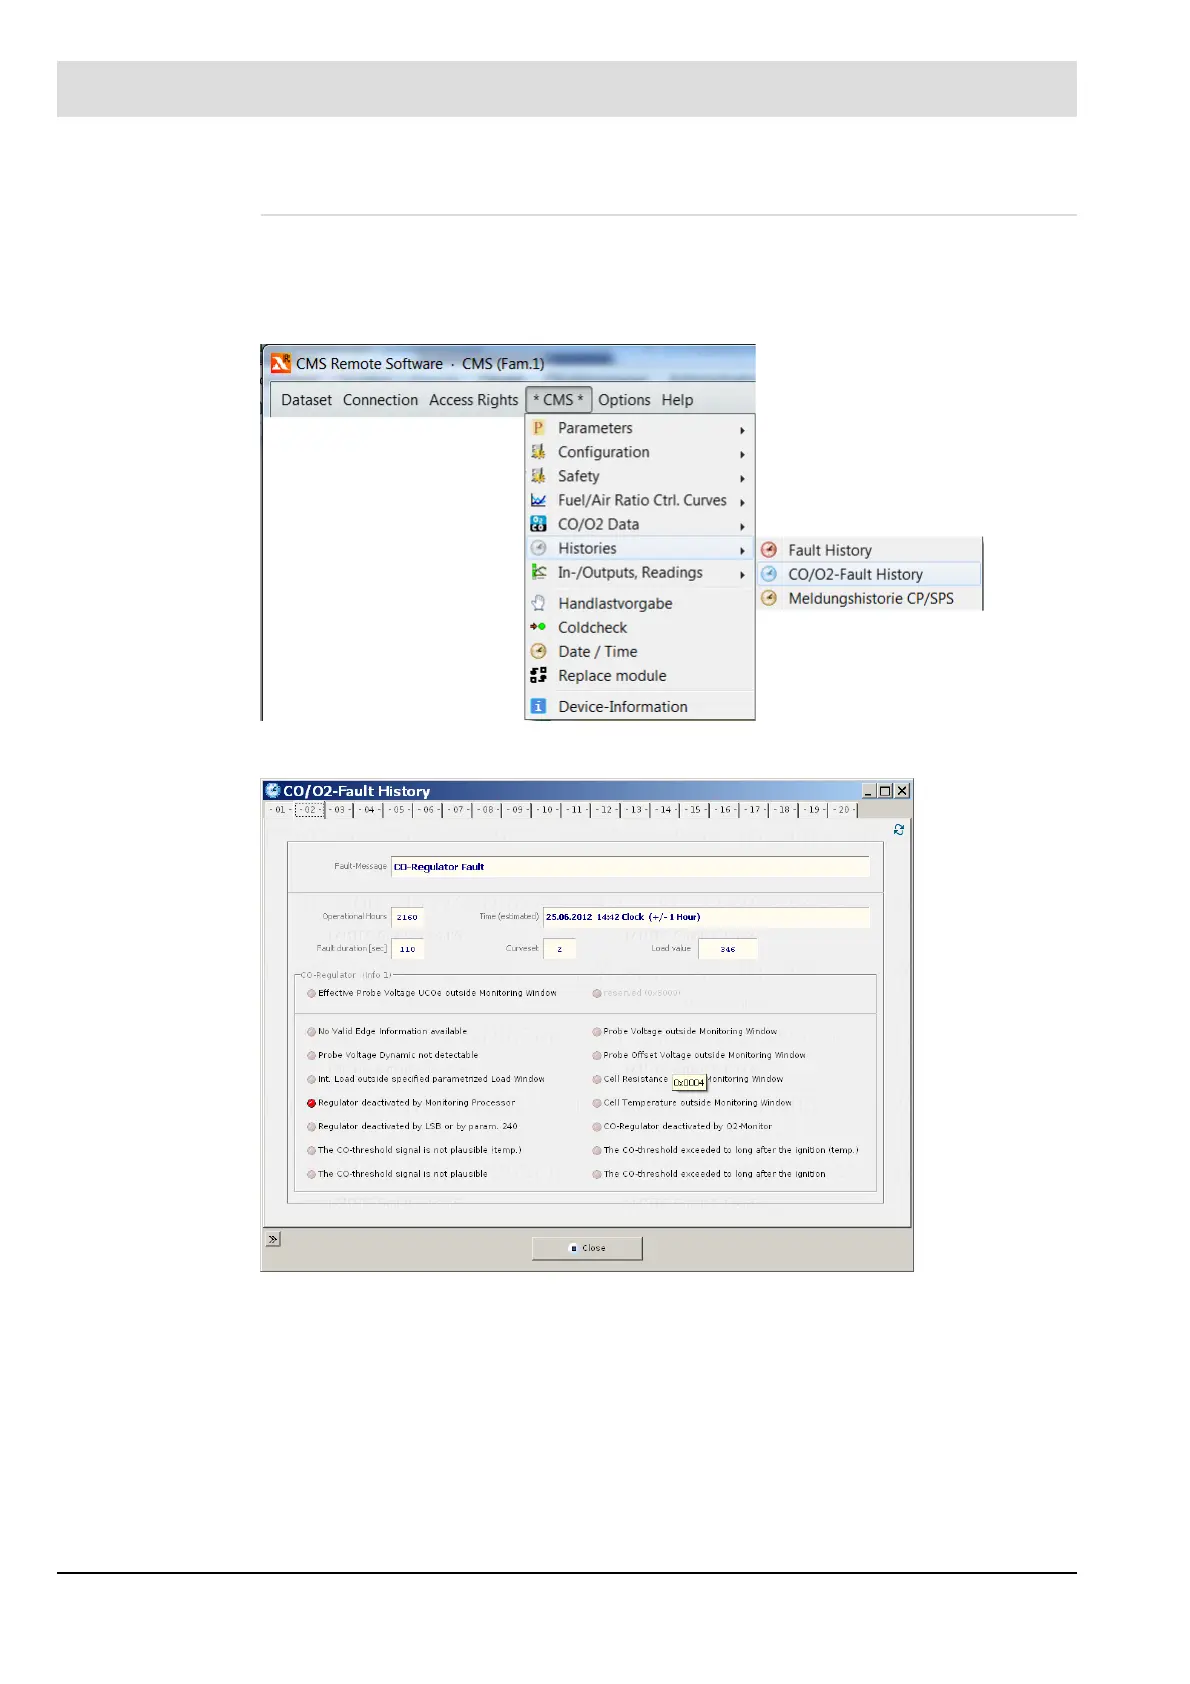
Calling the CO/O
2
Fault History
CO/O
2
fault history
• When the data sets are saved, the log of the last 20 faults is also saved. The faults are
indicated by a mouse click on the flag of the tabs.
Fig. 8-32 CO/O
2
fault history menu
Fig. 8-33 CO/O
2
fault history
• Display of the fault and its duration.
The current curve set and the firing rate value at the time the fault occurred are also dis-
played. In online mode, the time at which the fault occurs is calculated and displayed. Due
to power failures or "Power OFF", the calculated time may deviate from the actual time.
• The activated LED symbols indicate the cause of the fault.
 Loading...