186
Fuel Consumption
Fuel Consumption
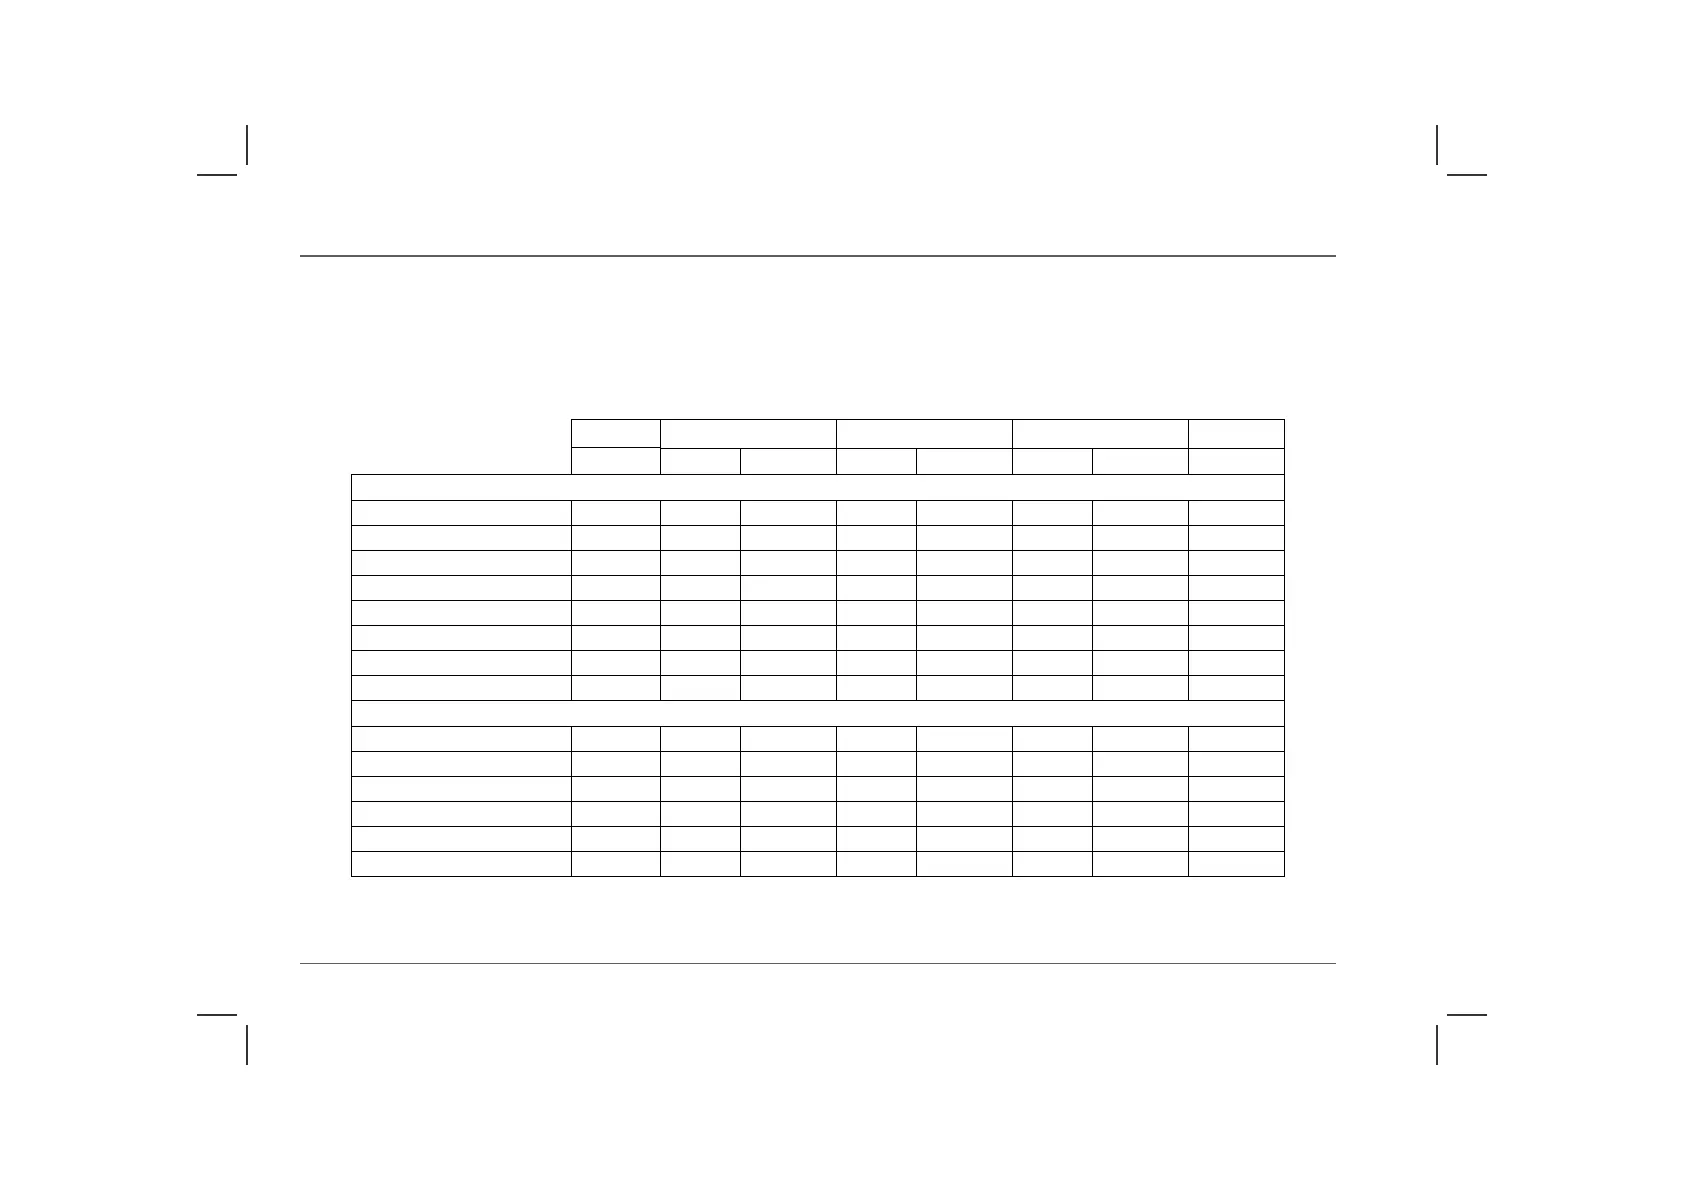
FUEL CONSUMPTION
The fuel consumption figures shown below have been calculated using a standard testing procedure (the new EC test procedure from
Directive 99/100/EC), and produced in accordance with The Passenger Car Fuel Consumption (Amendment) Order 1996. Under normal
use, a car's actual fuel consumption figures may differ from those achieved through the test procedure, depending on driving technique,
road and traffic conditions, environmental factors, vehicle load and condition.
Fuel consumption figures
Power URBAN EXTRA-URBAN COMBINED CO
2
kW mpg l/100km mpg l/100km mpg l/100km g/km
25 models
1.1 manual 55 31.3 9.0 50.8 5.6 41.3 6.8 164
1.4 LP manual 62 31.1 9.1 51.1 5.5 41.3 6.8 164
1.4 manual 76 31.1 9.1 51.1 5.5 41.3 6.8 164
1.6 manual 80 30.8 9.2 51.9 5.4 41.3 6.8 164
1.6 automatic 80 25.5 11.1 49.3 5.7 36.6 7.7 184
1.8 automatic 86 24.5 11.5 45.9 6.2 34.7 8.1 194
2.0 Turbo Diesel 74 39.2 7.2 68.3 4.1 53.8 5.2 150
2.0 Turbo Diesel 83 36.7 7.7 67.3 4.2 51.5 5.5 150
ZR models
105 manual 76 31.1 9.1 51.1 5.5 41.3 6.8 164
120 manual 86 29.0 9.7 51.1 5.5 39.8 7.1 169
120 automatic 86 24.5 11.5 45.9 6.2 34.7 8.1 194
160 manual 118 27.1 10.4 48.7 5.8 37.6 7.5 179
2.0 Turbo Diesel 74 39.2 7.2 68.3 4.1 53.8 5.2 150
2.0 Turbo Diesel 83 36.7 7.7 67.3 4.2 51.5 5.5 150
 Loading...