Evaluating gray values
To mark anomalies in the image and evaluate gray scales
statistically within special Regions of Interest (ROI), you can draw a
graphic around the region.
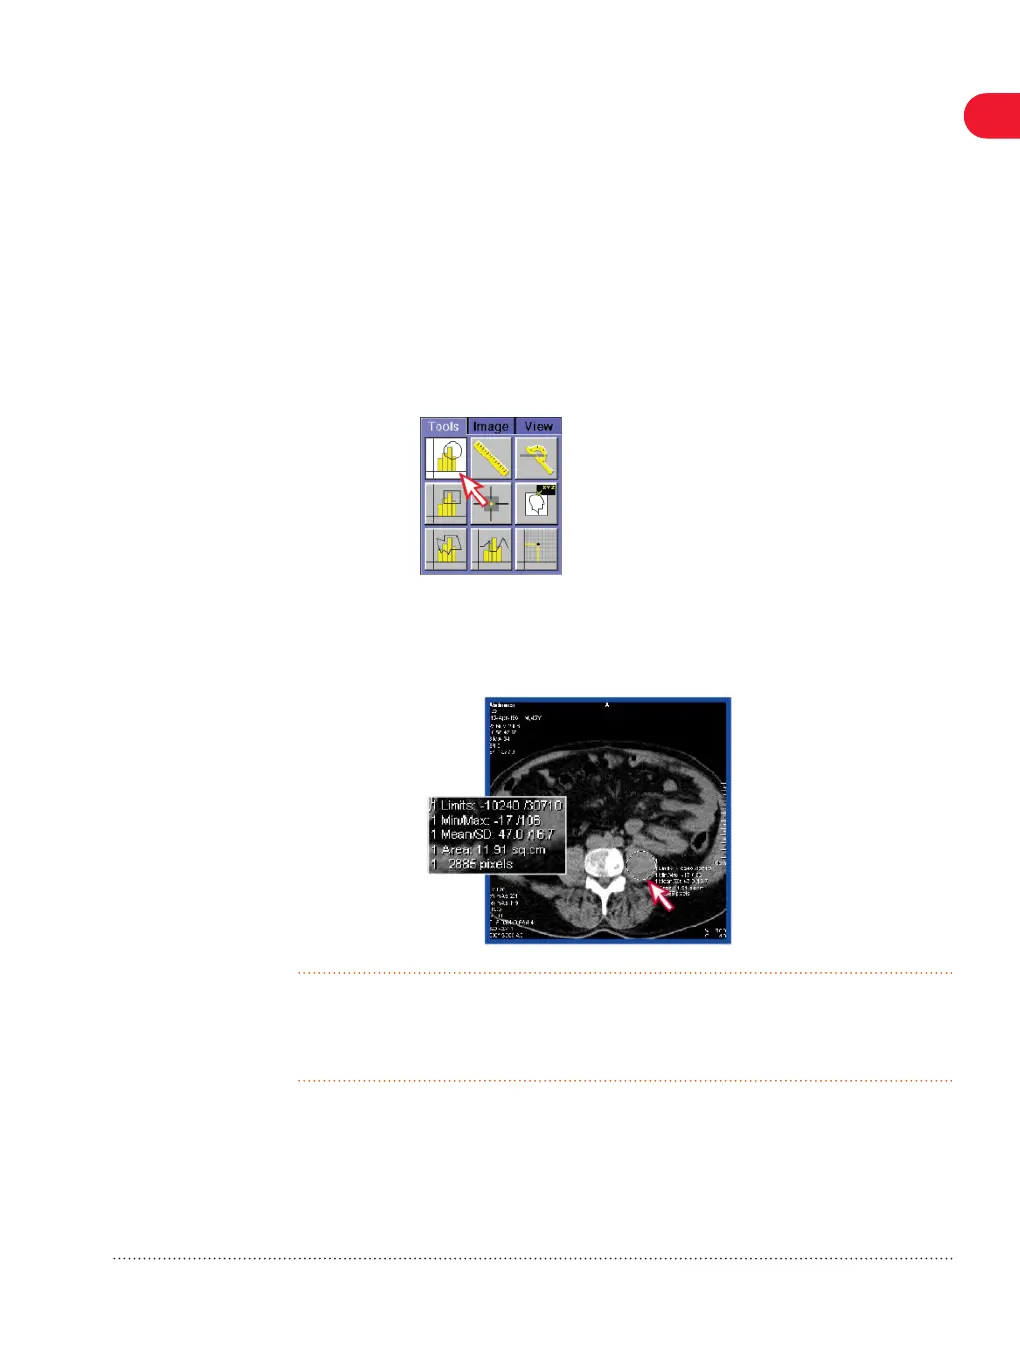
1 On the Tools tab, click the Circle icon.
2 Click the image and drag the mouse pointer to any direction until
the circle reaches the desired size.
The evaluation results are displayed in the image.
• To change the type of results, right-click the Circle icon to call up
Properties.
• To delete the circle, click it and press the Del key.
6.5
Reviewing images 6
SOMATOM Scope |
syngo
CT VC50
Print No. HC-C2-015-G.626.08.01.02
55
 Loading...