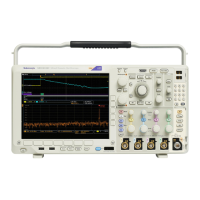
Figure 7: Lower (narrower) RBWs take longer to process, but have finer frequency resolution and a lower noise floor.
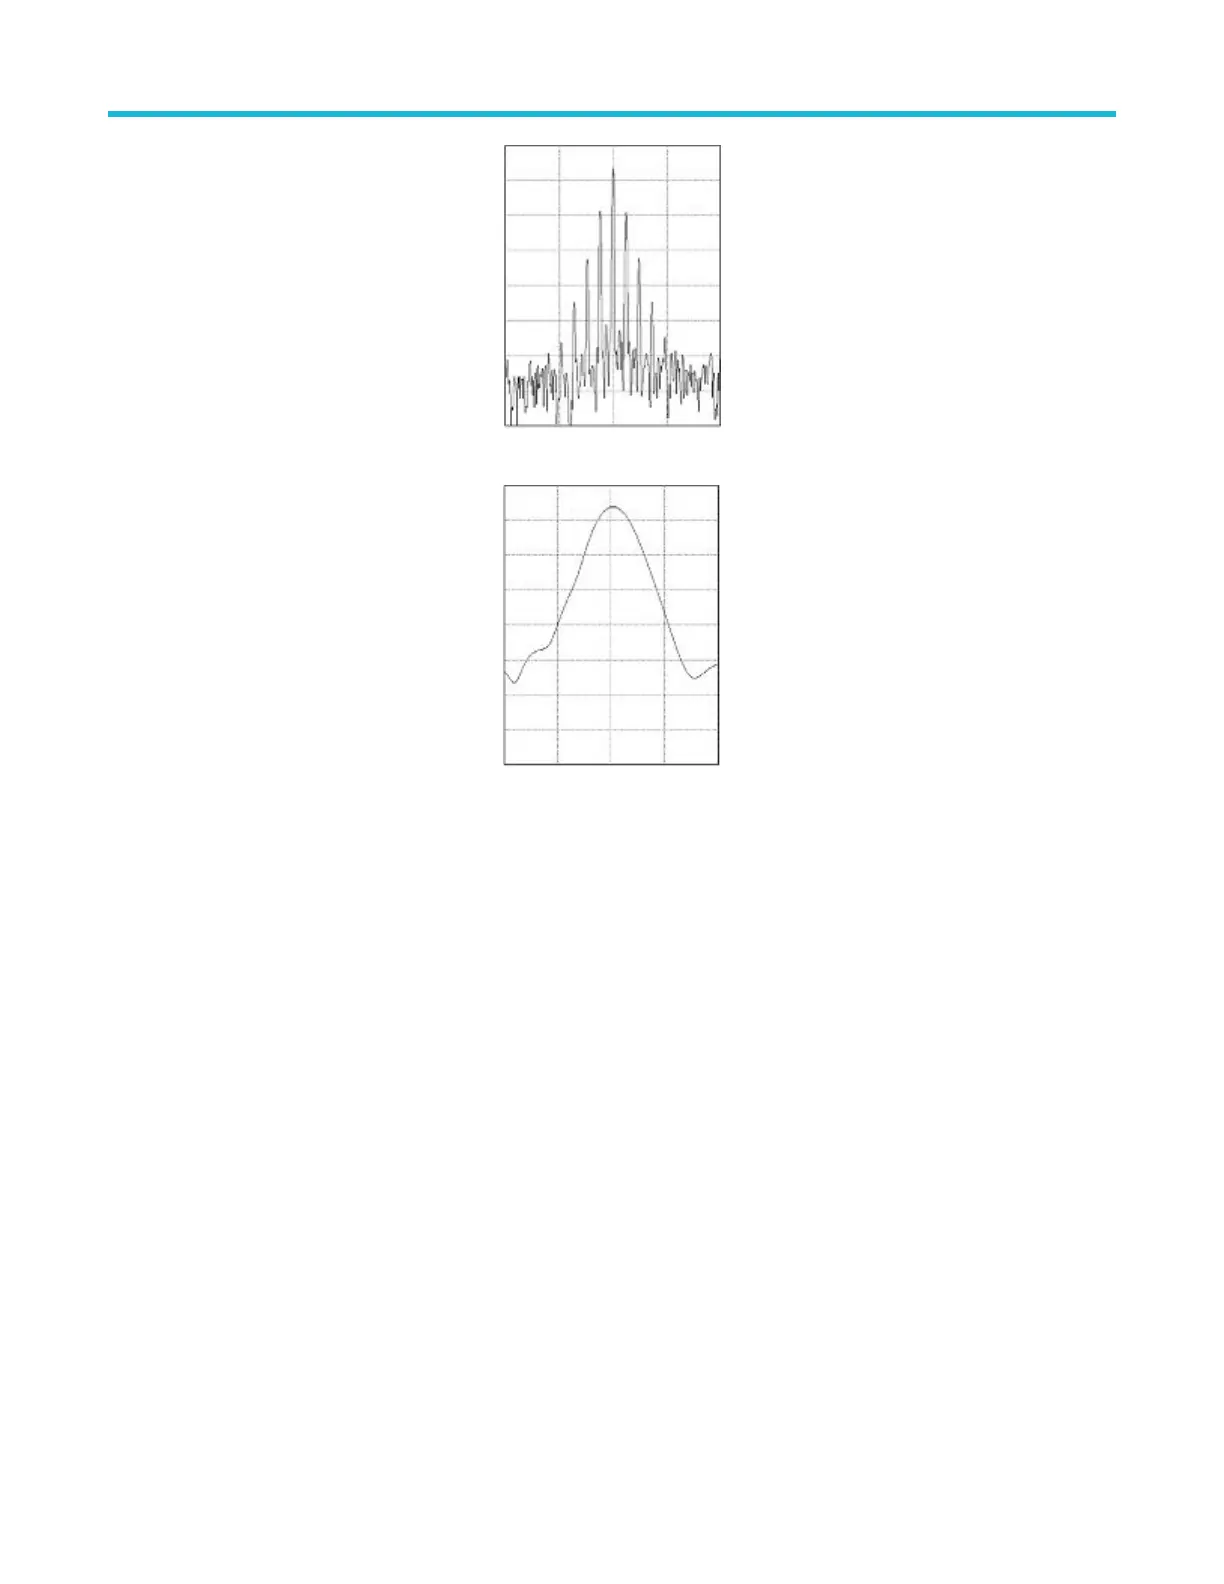
Figure 8: Higher (wider) RBWs take less time to process, but have less frequency resolution and a higher noise floor.
Do the following to adjust the resolution bandwidth.
1. In frequency domain mode, double-tap the Horizontal badge to display the Horizontal menu.
2. T
ap RBW Mode to select either Auto or Manual.
• Auto sets the resolution bandwidth automatically as you change the span. The default behavior is RBW = Span/1000.
• Manual allows you to set your own resolution bandwidth.
3. To manually adjust the RBW, tap RBW and turn the multipurpose knob.
4. Tap Span : RBW and use the multipurpose knob to set the span/RBW ratio.
This ratio is used when the RBW Mode is set to Auto. The default is 1000:1 but you can set it to other values.
5. Tap Window and select which FFT window to use. The choices are:
• Rectangular see Rectangular window on page 269
• Hanning see Hanning FFT window on page 268
• Hamming see Hamming window on page 269
• Blackman-Harris see Blackman-Harris FFT window concepts on page 268
Spectrogram display
The spectrogram display is useful for monitoring slowly-changing RF phenomena.
The spectrogram x-axis represents frequency, just like the typical spectrum display. The y-axis represents time. Color indicates amplitude.
Spectrogram slices are generated by taking each spectrum and flipping it on its edge so that it is one pixel row tall, and then assigning
colors to each pixel based on the amplitude at that frequency with the cold colors of blue and green representing low amplitude, and the
hotter colors of yellow and red indicating higher amplitude. Each new acquisition adds another slice at the bottom of the spectrogram, and
the history moves up one row.
Waveform acquisition concepts
3 Series Mixed Domain Oscilloscope Printable Help 244
 Loading...