Polar Graphing 5–3
825C44~1.DOC TI-83 international English Bob Fedorisko Revised: 10/26/05 1:20 PM Printed: 10/27/05 2:00
PM Page 3 of 6
The steps for defining a polar graph are similar to the steps for
defining a function graph. Chapter 5 assumes that you are
familiar with Chapter 3: Function Graphing. Chapter 5 details
aspects of polar graphing that differ from function graphing.
To display the mode screen, press z. To graph polar
equations, you must select
Pol graphing mode before you enter
values for the window variables and before you enter polar
equations.
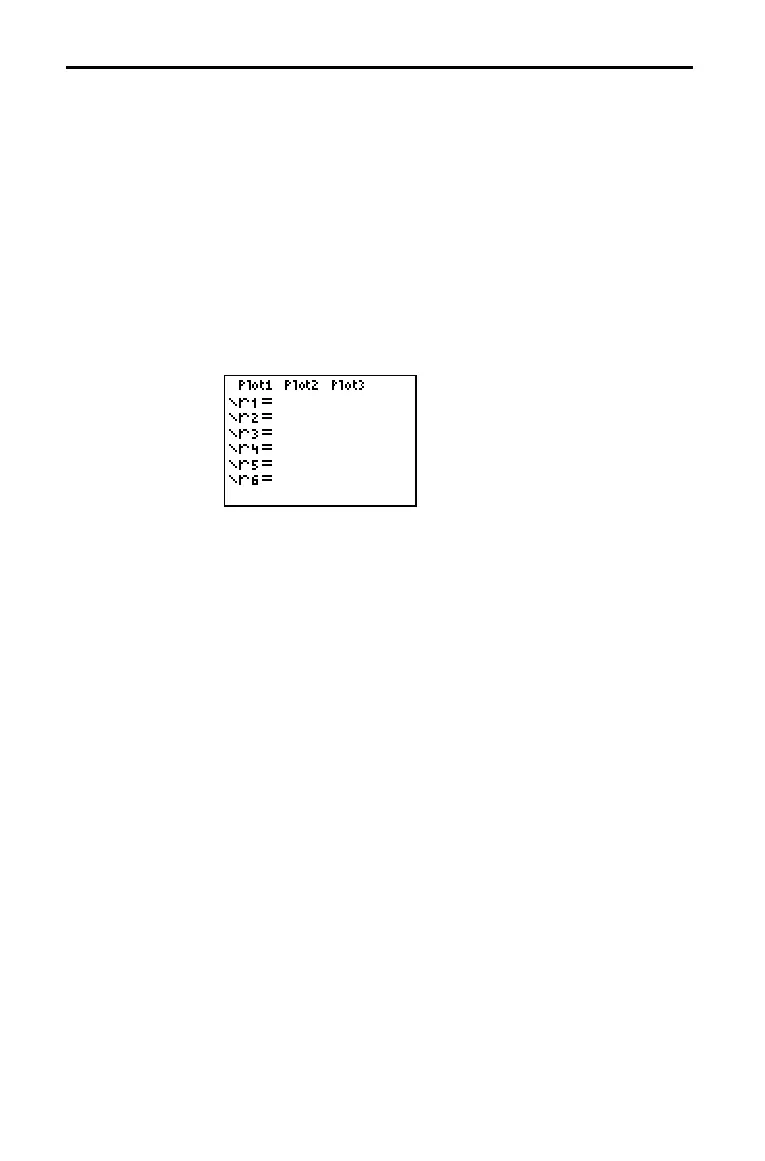
After selecting
Pol graphing mode, press o to display the polar
Y= editor.
In this editor, you can enter and display up to six polar
equations,
r1 through r6. Each is defined in terms of the
independent variable
q (page 5.4).
The icons to the left of
r1 through r6 represent the graph style of
each polar equation (Chapter 3). The default in
Pol graphing
mode is ç (line), which connects plotted points. Line, è (thick),
ë (path), ì (animate), and í (dot) styles are available for polar
graphing.
Defining and Displaying Polar Graphs
TI-82 STATS
Graphing Mode
Similarities
Setting Polar
Graphing Mode
Displaying the
Polar Y= Editor
Selecting Graph
Styles

 Loading...


