Getting Started 11
82STAT~1.DOC TI-83 international English Bob Fedorisko Revised: 10/27/05 1:33 PM Printed: 10/27/05 3:30
PM Page 11 of 18
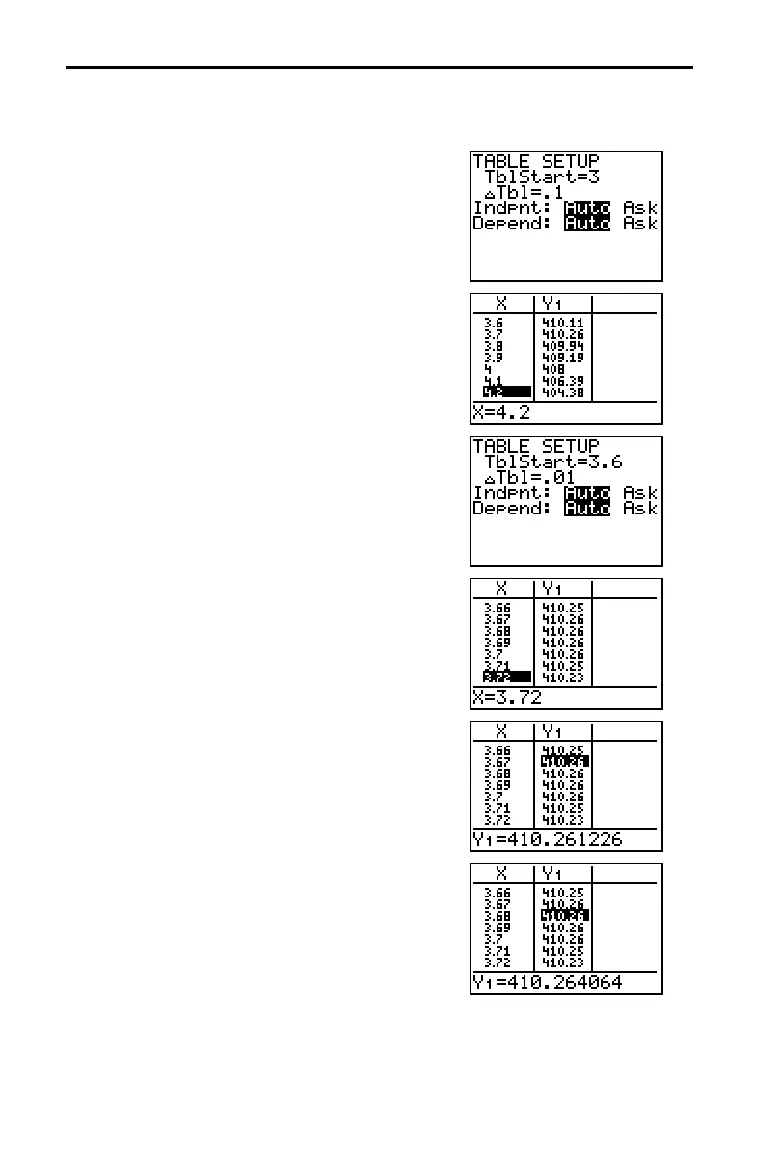
You can adjust the way a table is displayed to get more information about a defined
function. With smaller values for
@Tbl, you can zoom in on the table.
1. Press 3 Í to set TblStart. Press Ë 1
Í to set @Tbl.
This adjusts the table setup to get a more
accurate estimate of
X for maximum volume
Y1.
2. Press y [TABLE].
3. Press † and } to scroll the table.
Notice that the maximum value for
Y1 is
410.26, which occurs at X=3.7. Therefore, the
maximum occurs where
3.6<X<3.8.
4. Press y [TBLSET]. Press 3 Ë 6 Í to set
TblStart. Press Ë 01 Í to set @Tbl.
5. Press y [TABLE], and then press † and } to
scroll the table.
Four equivalent maximum values are shown,
410.60 at X=3.67, 3.68, 3.69, and 3.70.
6. Press † and } to move the cursor to 3.67.
Press ~ to move the cursor into the
Y1
column.
The value of
Y1 at X=3.67 is displayed on the
bottom line in full precision as
410.261226.
7. Press † to display the other maximums.
The value of Y1 at X=3.68 in full precision is
410.264064, at X=3.69 is 410.262318, and at
X=3.7 is 410.256.
The maximum volume of the box would occu
at 3.68 if you could measure and cut the paper at
.01-cm. increments.
Zooming In on the Table: Box with Lid

 Loading...


