Function Graphing 3.5
82533F~1.DOC TI-83 international English Bob Fedorisko Revised: 10/26/05 1:20 PM Printed: 10/27/05 1:55
PM Page 5 of 28
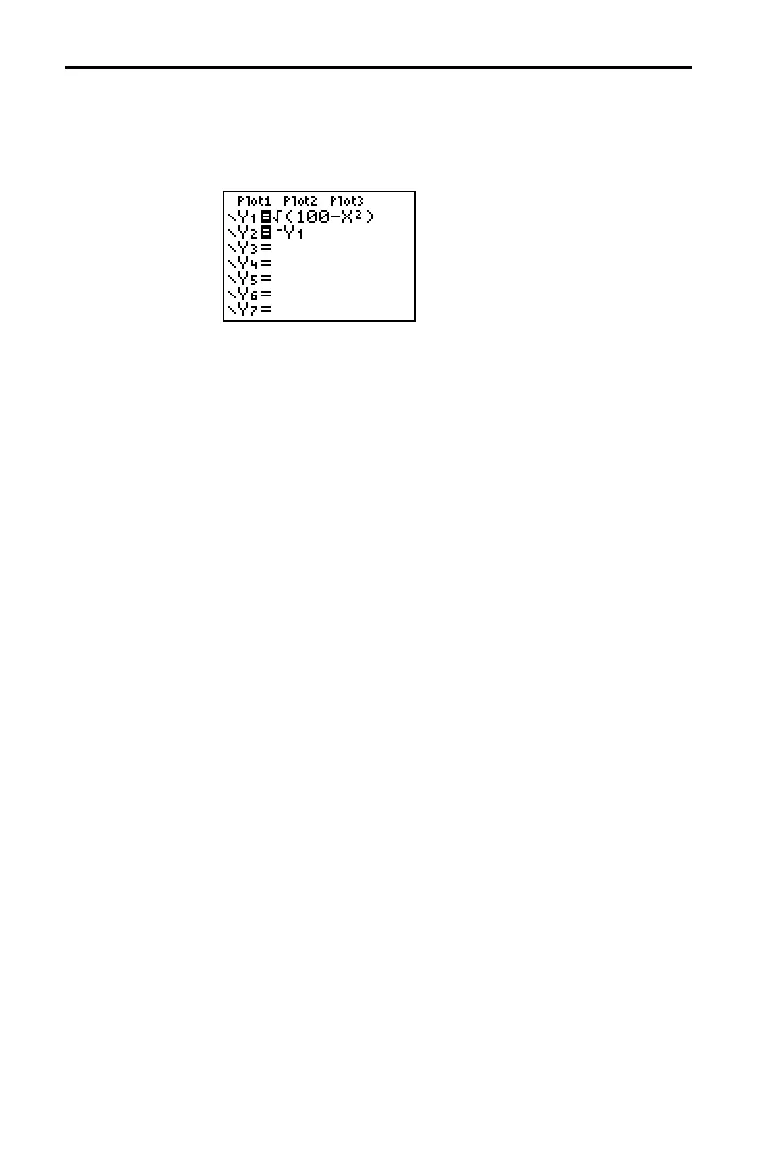
To display the Y= editor, press o. You can store up to 10
functions to the function variables
Y1 through Y9, and Y0. You
can graph one or more defined functions at once. In this
example, functions
Y1 and Y2 are defined and selected.
To define or edit a function, follow these steps.
1. Press o to display the Y= editor.
2. Press † to move the cursor to the function you want to
define or edit. To erase a function, press ‘.
3. Enter or edit the expression to define the function.
• You may use functions and variables (including matrices
and lists) in the expression. When the expression
evaluates to a nonreal number, the value is not plotted; no
error is returned.
• The independent variable in the function is
X. Func mode
defines „ as X. To enter X, press „ or press
ƒ [X].
• When you enter the first character, the
= is highlighted,
indicating that the function is selected.
As you enter the expression, it is stored to the variable
Yn as
a user-defined function in the
Y= editor.
4. Press Í or † to move the cursor to the next function.
Defining Functions
Displaying
Functions in the
= Edito
Defining or
Editing a
Function

 Loading...


