Function Graphing 3.9
82533F~1.DOC TI-83 international English Bob Fedorisko Revised: 10/26/05 1:20 PM Printed: 10/27/05 1:55
PM Page 9 of 28
This table describes the graph styles available for function
graphing. Use the styles to visually differentiate functions to be
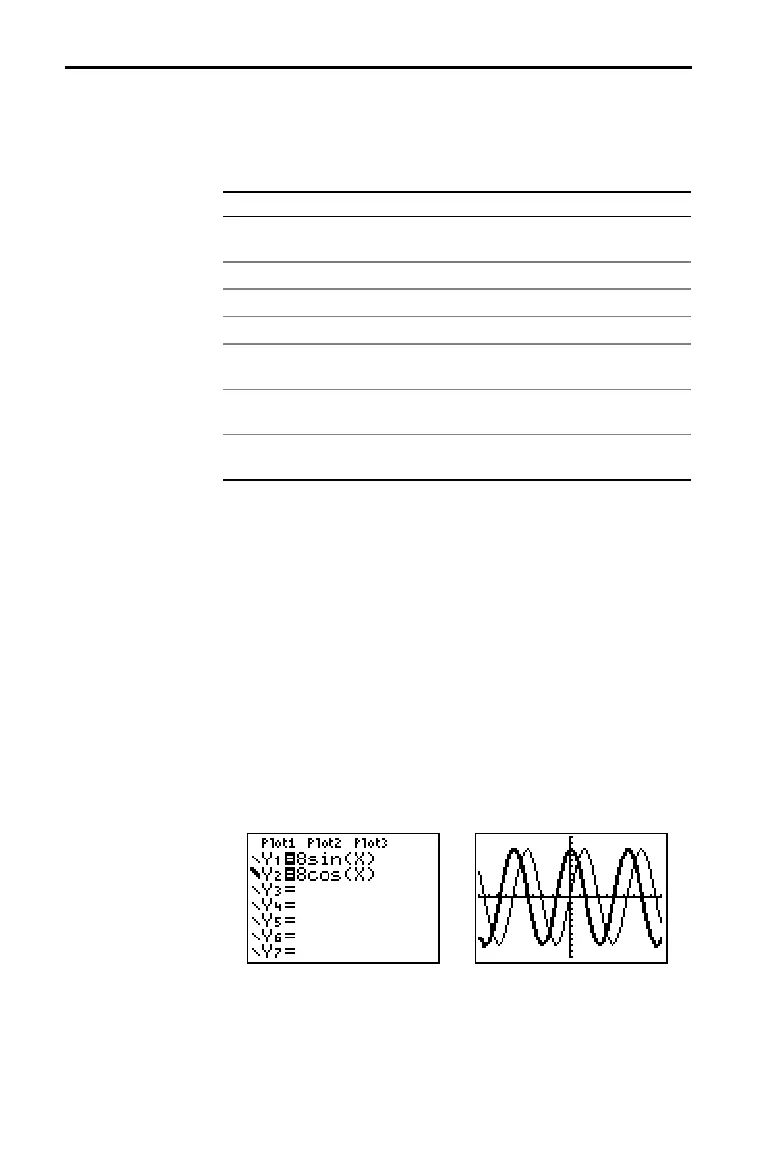
graphed together. For example, you can set
Y1 as a solid line, Y2
as a dotted line, and Y3 as a thick line.
Icon Style Description
ç Line A solid line connects
lotted
oints; this is the
default in Connected mode
è Thick A thick solid line connects plotted points
é Above Shading covers the area a*bove the graph
ê Below Shading covers the area below the graph
ë Path A circular cursor traces the leadin
ed
e of the
graph and draws a path
ì Animate A circular cursor traces the leadin
ed
e of the
graph without drawing a path
í Dot A small dot re
resents each
lotted
oint; this
is the default in Dot mode
Note: Some graph styles are not available in all graphing modes.
Chapters 4, 5, and 6 list the styles for Par, Pol, and Seq modes.
To set the graph style for a function, follow these steps.
1. Press o to display the Y= editor.
2. Press † and } to move the cursor to the function.
3. Press | | to move the cursor left, past the = sign, to the
graph style icon in the first column. The insert cursor is
displayed. (Steps 2 and 3 are interchangeable.)
4. Press Í repeatedly to rotate through the graph styles.
The seven styles rotate in the same order in which they are
listed in the table above.
5. Press ~, }, or † when you have selected a style.
Setting Graph Styles for Functions
Graph Style
Icons in the Y=
Editor
Setting the Graph
Style