Function Graphing 3.7
82533F~1.DOC TI-83 international English Bob Fedorisko Revised: 10/26/05 1:20 PM Printed: 10/27/05 1:55
PM Page 7 of 28
You can select and deselect (turn on and turn off) a function in
the
Y= editor. A function is selected when the = sign is
highlighted. The TI-82 STATS graphs only the selected
functions. You can select any or all functions
Y1 through Y9, and
Y0.
To select or deselect a function in the Y= editor, follow these
steps.
1. Press o to display the
Y= editor.
2. Move the cursor to the function you want to select or
deselect.
3. Press | to place the cursor on the function’s
= sign.
4. Press Í to change the selection status.
When you enter or edit a function, it is selected automatically.
When you clear a function, it is deselected.
To view and change the on/off status of a stat plot in the
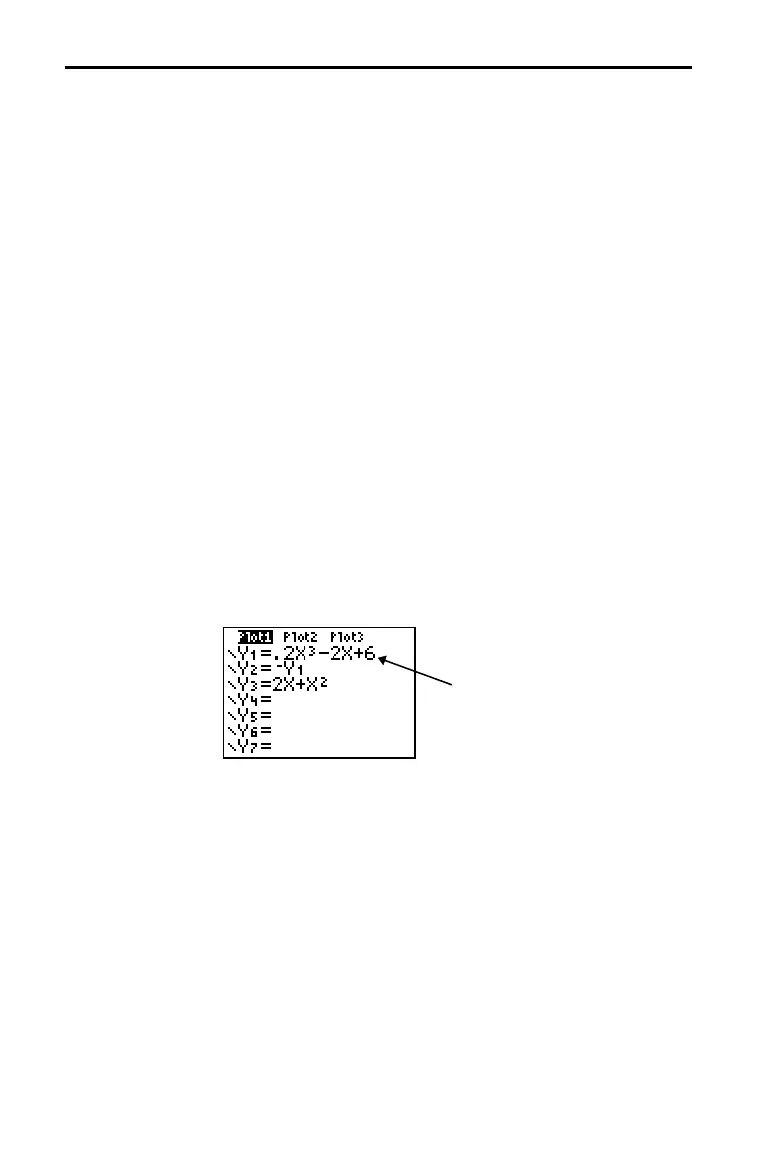
Y= editor, use Plot1 Plot2 Plot3 (the top line of the Y= editor).
When a plot is on, its name is highlighted on this line.
To change the on/off status of a stat plot from the
Y= editor,
press } and ~ to place the cursor on
Plot1, Plot2, or Plot3, and
then press Í.
Selecting and Deselecting Functions
Selecting and
Deselecting a
Function
Turning On or
Turning Off a Stat
Plot in the Y=
Editor
Plot1 is turned on.
Plot2 and Plot3 are turned off.