12–38 Statistics
82D315~1.DOC TI-83 international English Bob Fedorisko Revised: 10/26/05 1:36 PM Printed: 10/27/05 2:53
PM Page 38 of 38
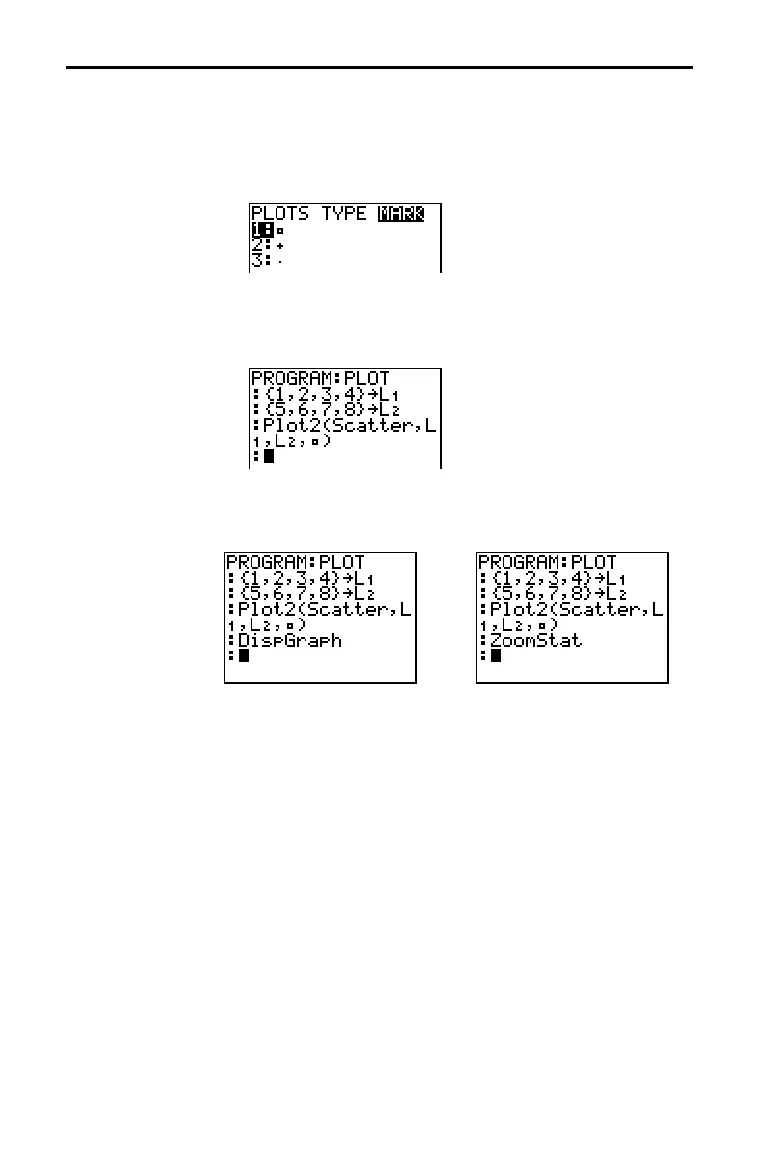
5. Press ¢. Enter the list names, separated by commas.
6. Press ¢ y [
STAT PLOT] | to display the
STAT PLOT MARK menu. (This step is not necessary if you
selected
3:Histogram or 5:Boxplot in step 4.)
Select the type of mark (› or + or ¦) for each data point. The
selected mark symbol is pasted to the cursor location.
7. Press ¤ Í to complete the command line.
To display a plot from a program, use the DispGraph instruction
(Chapter 16) or any of the
ZOOM instructions (Chapter 3).
Statistical Plotting in a Program (continued)
Defining a Stat
Plot in a Program
(continued)
Displaying a Stat
Plot from a
Program

 Loading...


