Applications 17–15
82501F~1.DOC TI-83 international English Bob Fedorisko Revised: 10/26/05 1:49 PM Printed: 10/27/05 3:04
PM Page 15 of 20
Explore the functions defined by
y =
‰
M
2
x
t
2
dt, ‰
0
x
t
2
dt, and ‰
2
x
t
2
dt
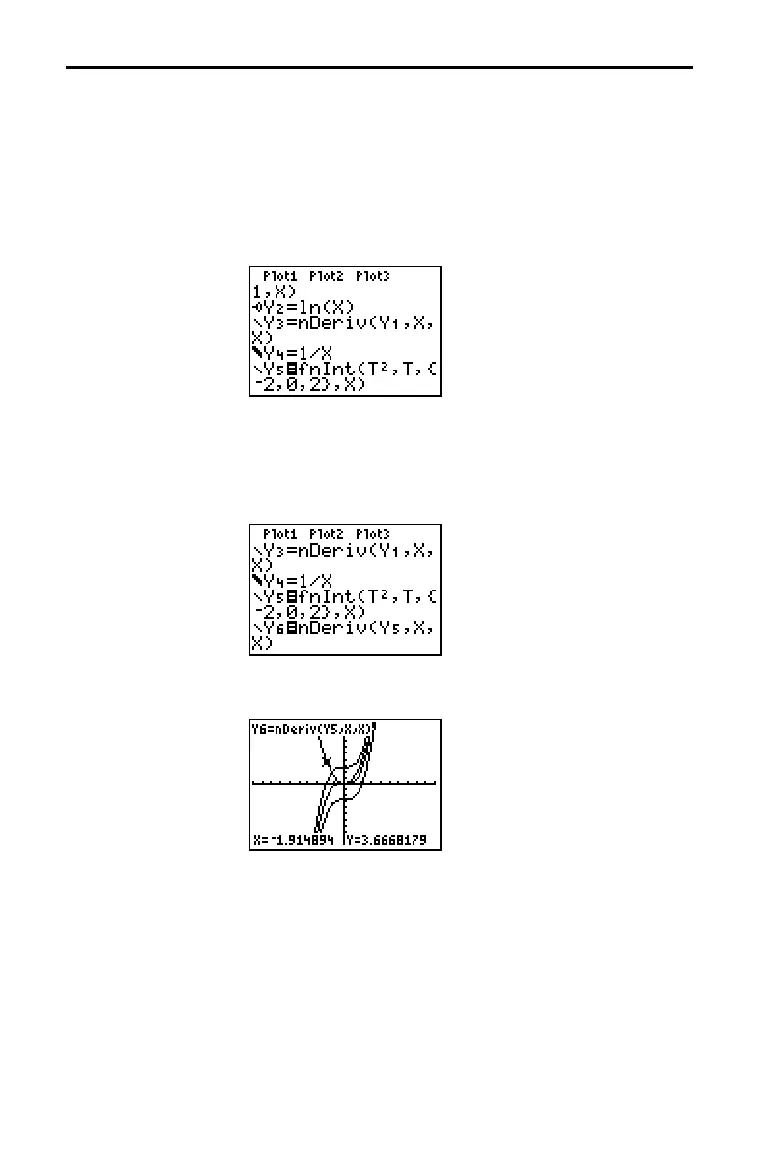
1. Press o. Turn off all functions and stat plots. Use a list to
define these three functions simultaneously. Store the
function in
Y5.
2. Press q 6 to select 6:ZStandard.
3. Press r. Notice that the functions appear identical, only
shifted vertically by a constant.
4. Press o. Enter the numerical derivative of
Y5 in Y6.
5. Press r. Notice that although the three graphs defined
by
Y5 are different, they share the same derivative.
Problem 2
Procedure 2

 Loading...


