1. The Need for Upgrade
1-2
TI 33K01B10-50E
1.1 System Deterioration Due to Aging
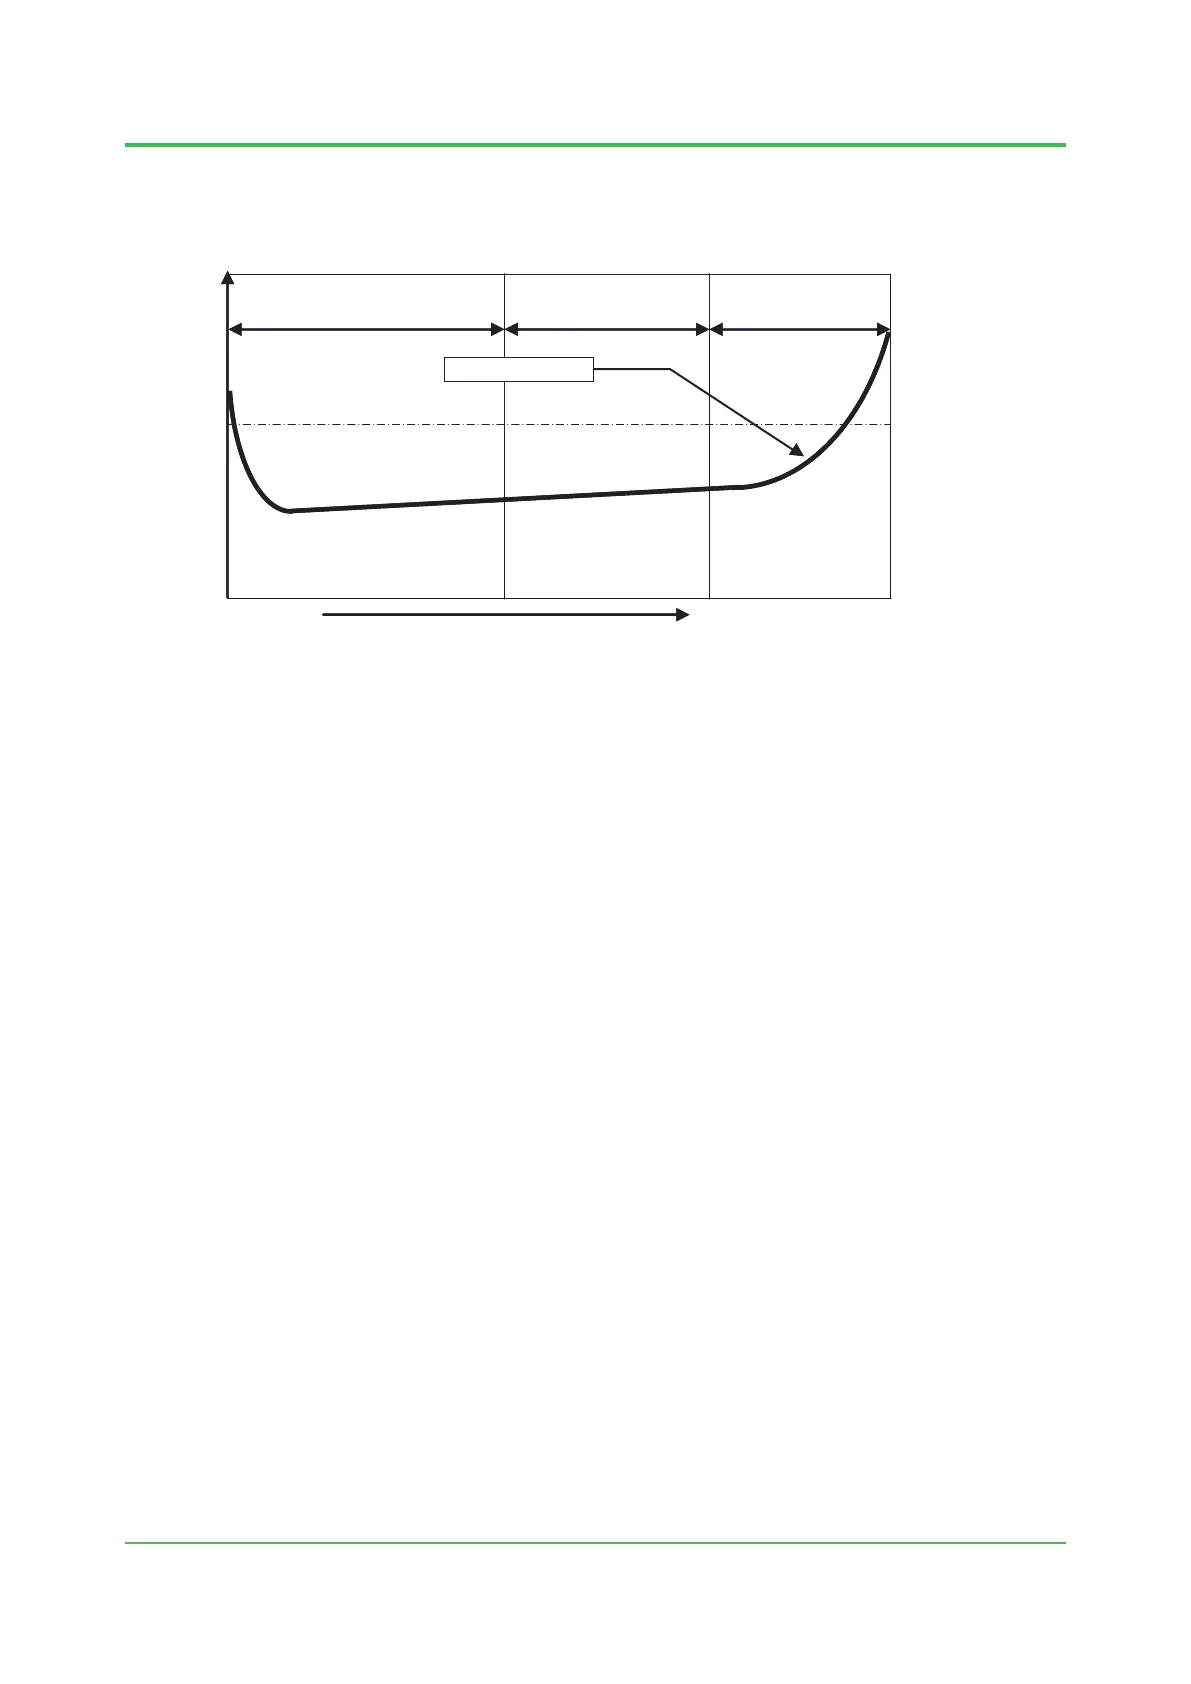
System deterioration can generally be predicted by the so-called bathtub curve as shown in the
followinggure:
Coincident failure cycle
Required reliability
(allowable failure rate)
Shift toward
deterioration cycle
Time
End-of-life cycle
F010101E.EPS
Failure rate (λ)
Deterioration curve
Figure System Deterioration Due to Aging
The failure rate of a system can be taken as a combination of the component parts’ failure rates.
• Temperature:
Failure rate doubles as the temperature rises by 10 °C.
• Humidity:
Corrosive of exposed parts accelerates under a humidity of 60 % or more.
• Corrosivegas:
Corrosive and other reactions occur in the exposed parts.
• Dust:
Short circuits and corrosion are caused.
The failure rate of a system can be taken as the integration of failure rates of its component parts
as follows.
Failurerateofsystem=∑λixNi(λ:failurerateofapart;N:numberofpartsused)
It is empirically ascertained that the ambient conditions largely affect the failure rate of a part as
aforementioned, and the deterioration rate of a system is the sum of the deterioration rates of its
parts.
To minimize the fall in plant operation rate (business loss) caused by aging, costly spare parts
and maintenance checks are necessary.
Mar. 27, 2015-00
 Loading...