23
9 DIAGRAM MENU
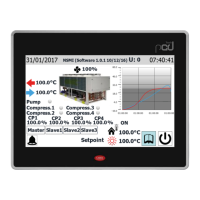
The CHART menu is used to view certain unit operating parameters, shown graphi-
cally on Cartesian axes to illustrate the value changes (temperature, power or pres-
sure) requested over time.
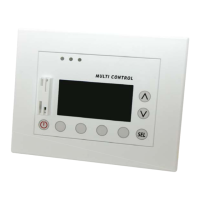
9.1 CHART SHOWING TEMPERATURE TREND OF INLET/
OUTLET WATER ON HEAT EXCHANGER
Displays a chart in real time, relating to the temperature of the water entering and
leaving the heat exchanger (in the lower part you can see a key explaining the col-
ours of the curves).
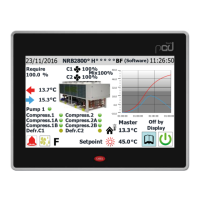
9.2 CHART SHOWING TREND OF COMPRESSORS ON
CIRCUIT 1
Displays a chart in real time, relating to the trend of the power values for the com-
pressors of circuit 1 (in the lower part you can see a key explaining the colours of
the curves)
9.3 CHART SHOWING TREND OF COMPRESSORS ON
CIRCUIT 2 IF INSTALLED
Displays a chart in real time, relating to the trend of the power values for the com-
pressors of circuit 2 (in the lower part you can see a key explaining the colours of
the curves)
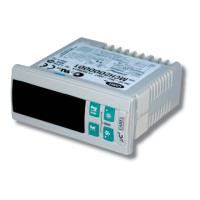
9.4 CHART SHOWING TREND OF HIGH/LOW PRESSURE ON
CIRCUIT 1
Displays a chart in real time, relating to the trend of the high/low pressure values on
circuit 1 (in the lower part you can see a key explaining the colours of the curves).
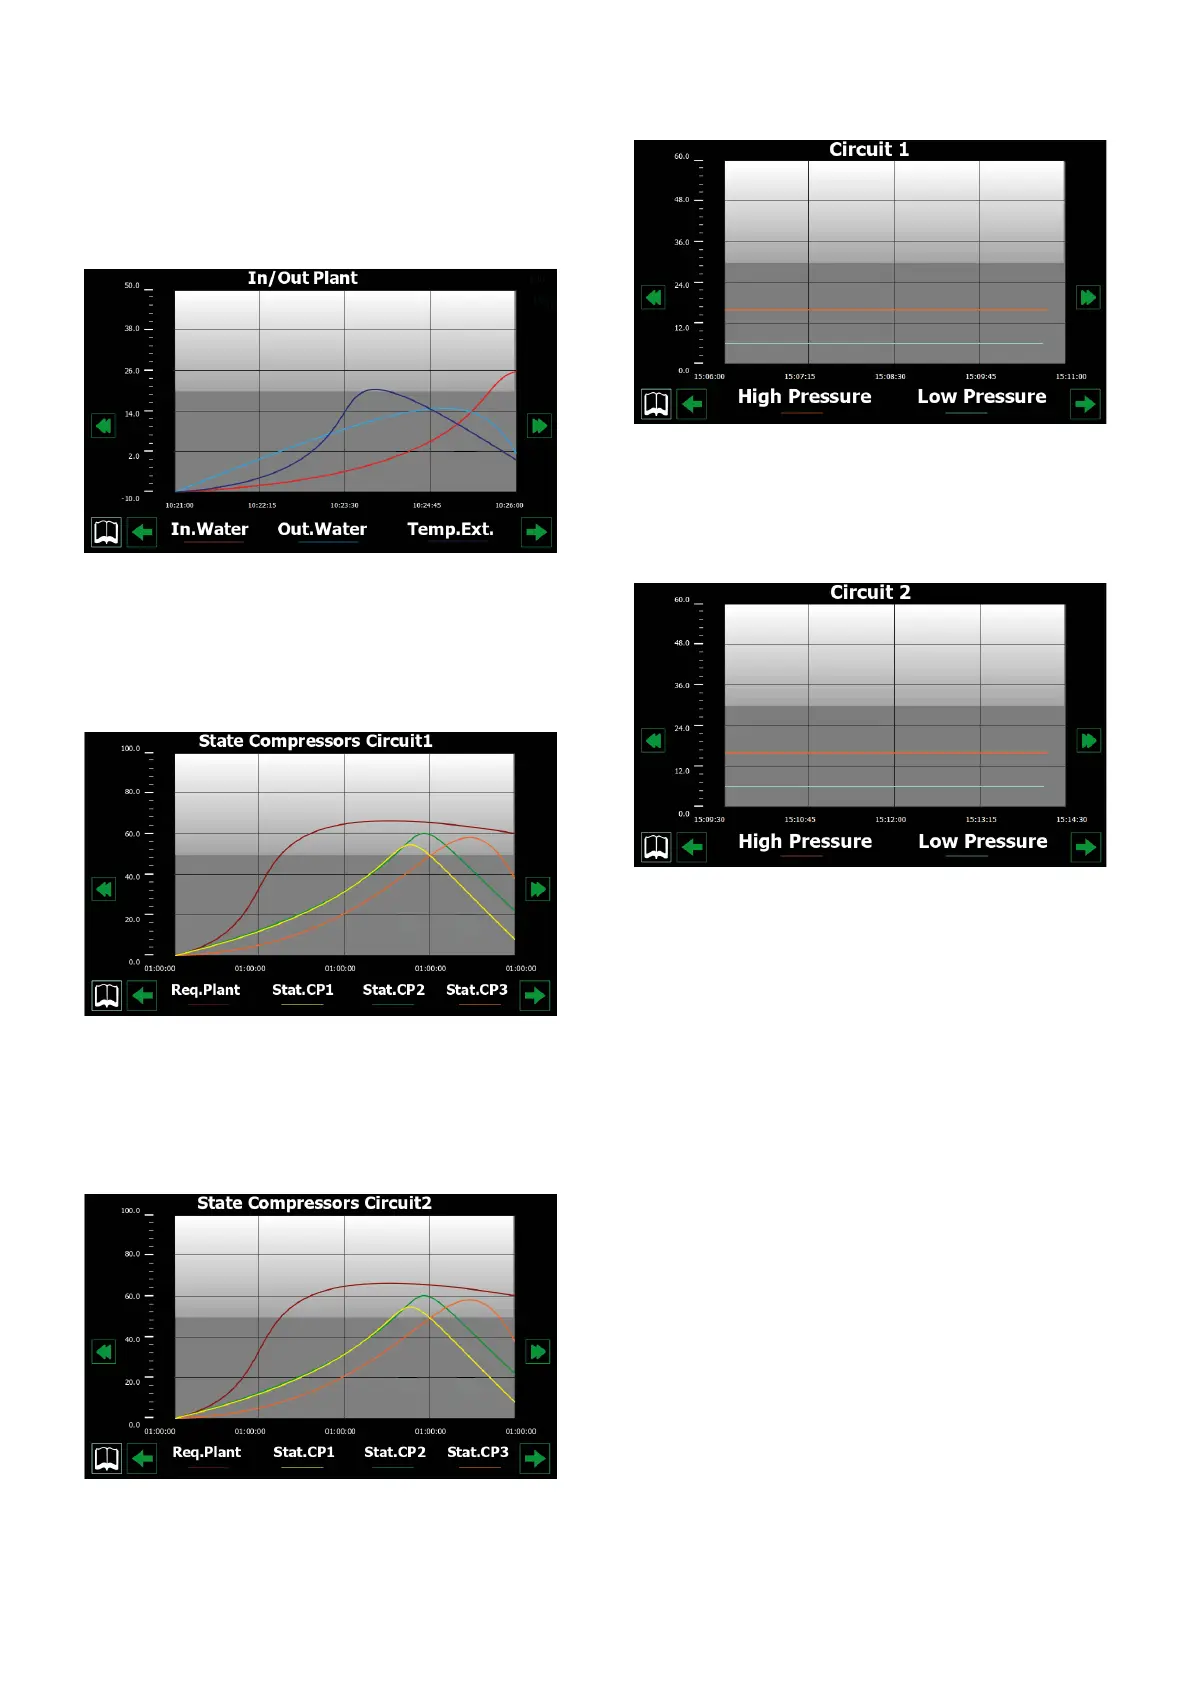
9.5 CHART SHOWING TREND OF HIGH/LOW PRESSURE ON
CIRCUIT 2 IF INSTALLED
Displays a chart in real time, relating to the trend of the high/low pressure values on
circuit 2 (in the lower part you can see a key explaining the colours of the curves).
 Loading...