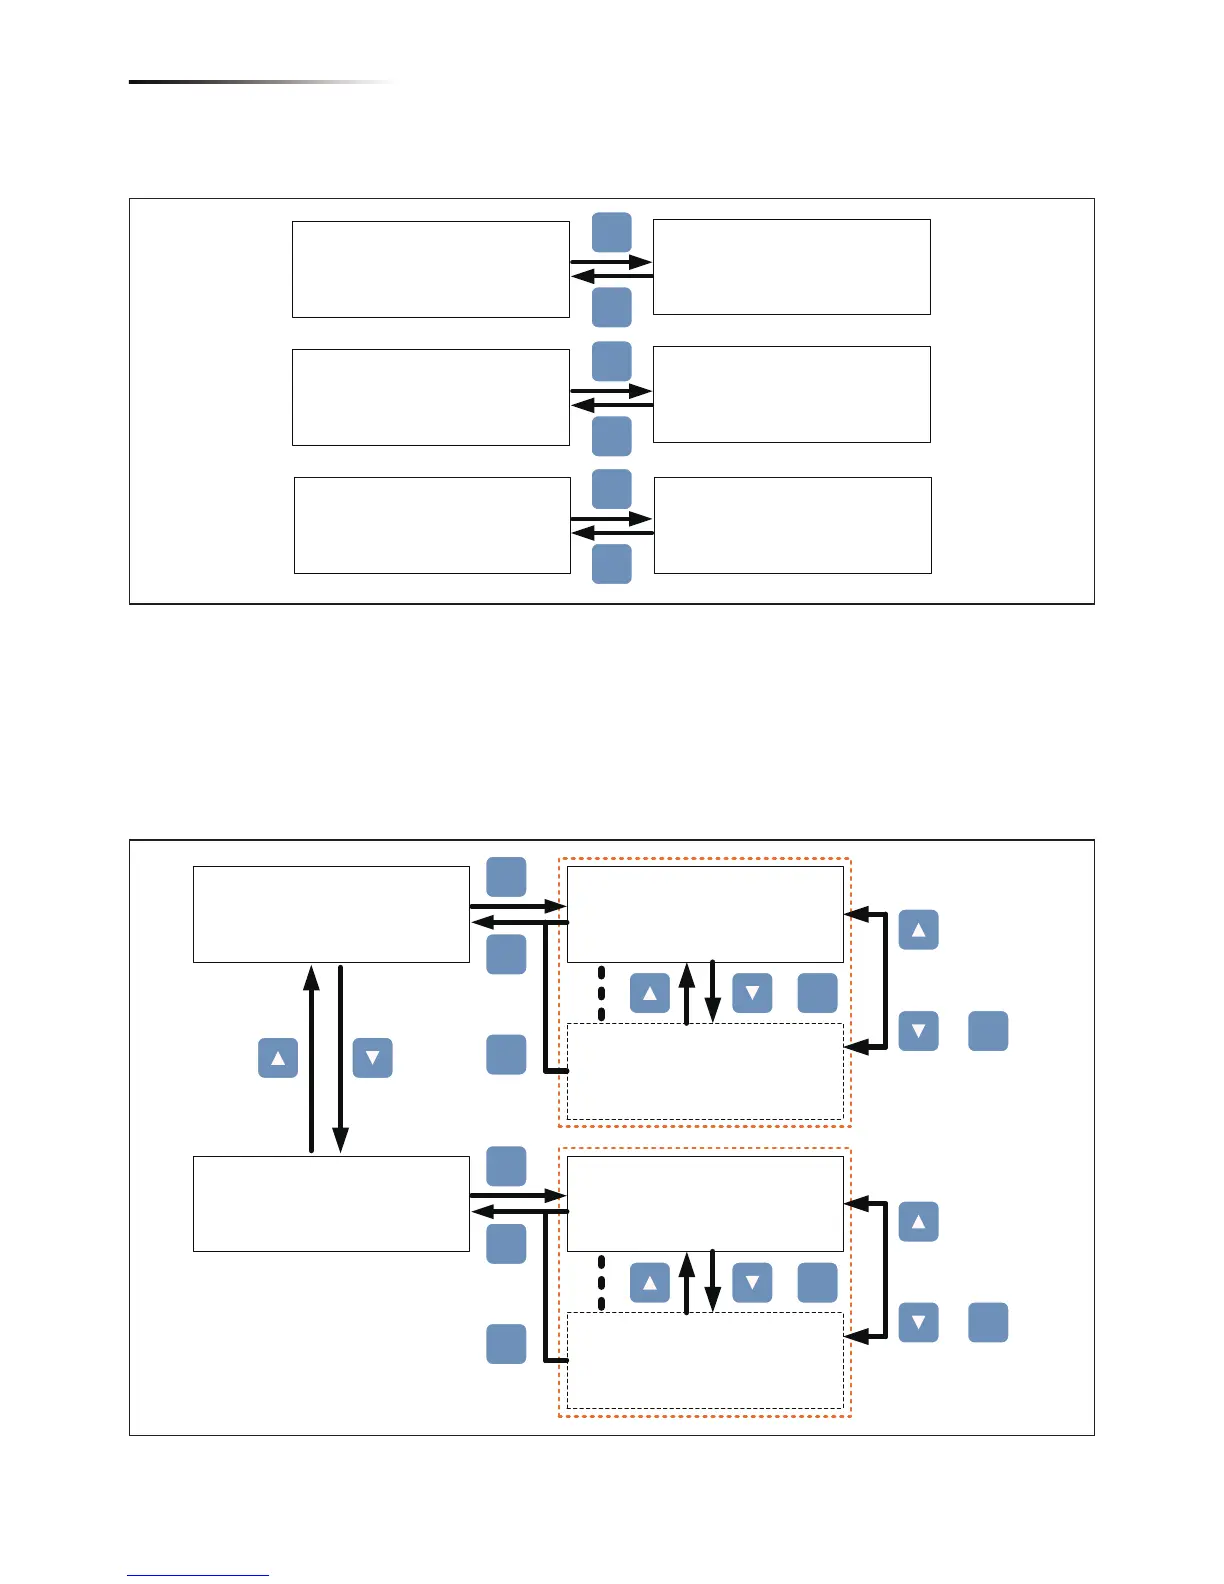
Figure 5-6 Energy log flow chart
Figure 5-7 Event log flow chart
5.3.2. Energy Log
User can view the inverter’s life energy and life runtime via Energy Log page.
5.3.3. Event Log
Event Log has two subpages: Error Events page and Grid Report page.
Error Events page displays all the events (Error and Fault) and it can show
30 records at a time. Grid Report page only displays the error that occurred
at grid side, and it can show 5 records at a time.
1. 20/04/2013 15:30
AC Freq High
2. 15/03/2013 09:30
HW Bus OVR
29. 20/02/2013 15:30
AC Freq High
30. 19/02/2013 09:30
AC Volt Low
or
or
Error Events
Grid Report
►
Error Events
Grid Report
►
1. 20/04/2013 15:30
AC Freq High
2. 15/03/2013 09:27
AC Volt Low
5. 27/02/2013 15:30
AC Freq High
or
or
EXIT
EXIT
ENT
EXIT
EXIT
ENT
ENT
ENT
ENT
ENT
Life Energy
E-Total:
Runtime:
29200
7302
kWh
Hrs
►Life Energy
Day Energy
Month Energy
Energy Day
2013.06.21
2013.06.20
2013.06.19
Life Energy
►Day Energy
Month Energy
Energy Month
2013.06
2013.05
2013.04
Life Energy
Day Energy
►Month Energy
kWh
kWh
kWh
7935
1234
8000
kWh
kWh
kWh
29200
0
0
EXIT
ENT
EXIT
ENT
EXIT
ENT
28
Turn on/off PV inverter
 Loading...