171
CHANGE THE 2D SONAR VIEW OVERLAYS
U
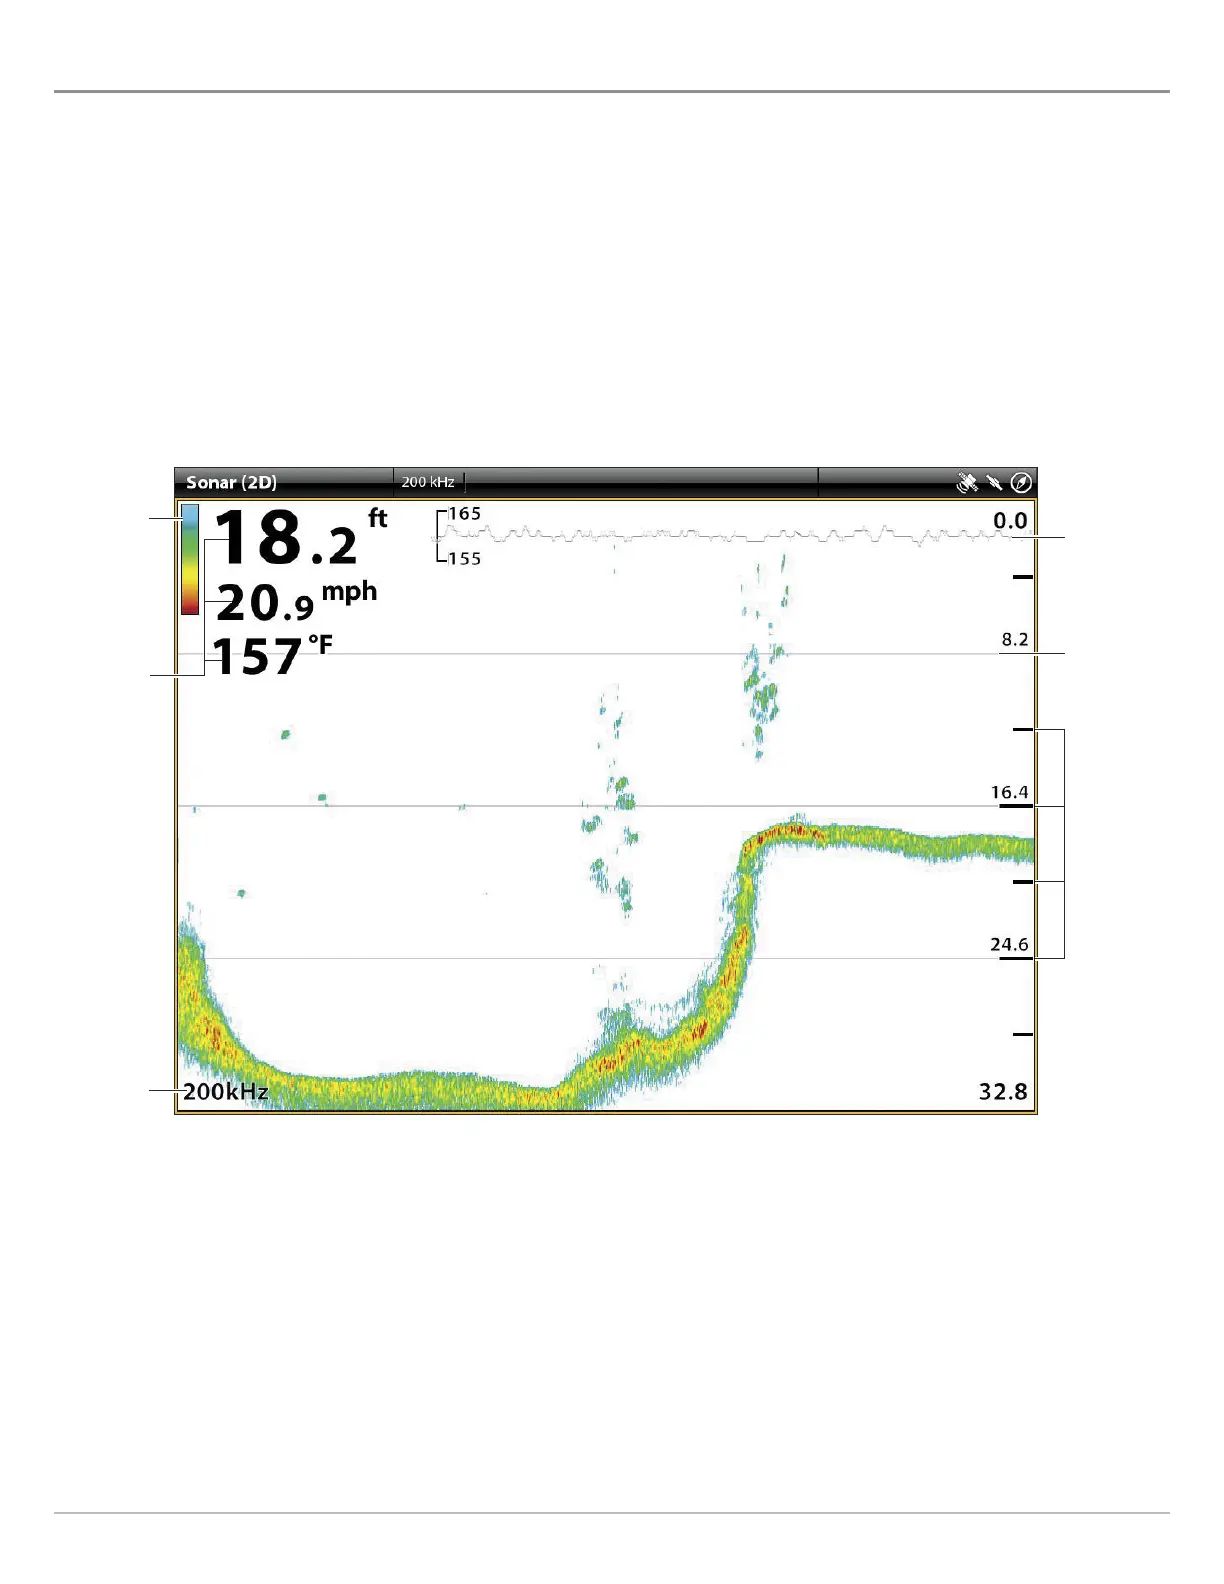
se the Overlays menu to display or hide information on the view. In the 2D Sonar View, you can display the following: depth lines,
d
epth range, a color bar for the selected palette, temperature graph, beam frequency label, and data overlays. Digital readout data
c
an be displayed as an overlay, and it can be displayed in the data bar. To turn on the data bar, see Views: Display a Data Bar. For
m
ore information about data overlays, see Views.
1. With a 2D Sonar View displayed on-screen, tap Sonar (2D) in the status bar, or press the MENU key once.
2. Select Sonar Options.
3. Select Overlays.
4. Tap the menu, or use the Joystick to select an item, and add a check mark. (check mark = visible, blank = hidden).
Selecting Overlays for the 2D Sonar View
color bar
indicates
the
selected
palette
data
overlays
frequency
label
temperature
graph
depth line
depth range
shows
incremental
marks
between the
upper and
lower depth
range
2D Sonar
 Loading...