47 TPES-B_TPEJ-B-BA-e-2319
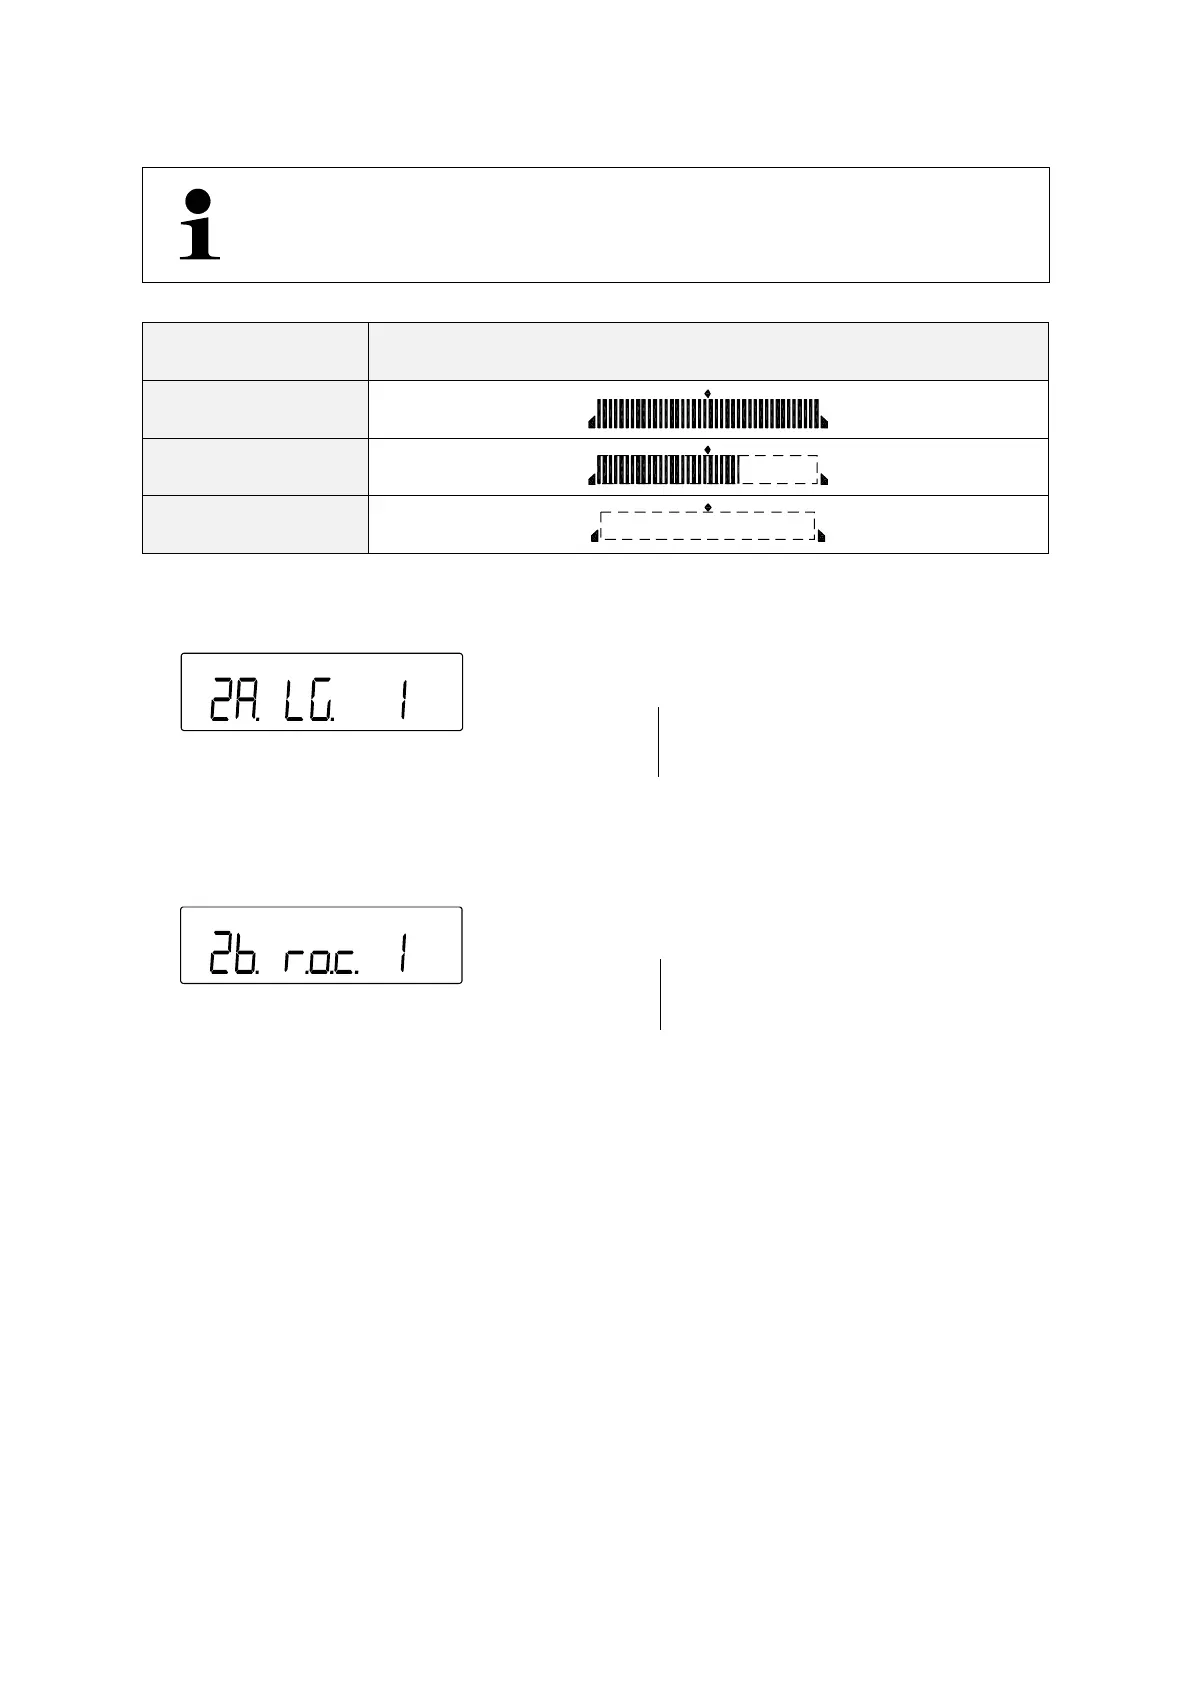
The evaluation of the weight value can also be shown on the bar graph display.
The bar graph display can only be used when 2 limits are set
(„-„ and „+“).
Evaluation of the
weight value
Upper tolerance limit
exceeded
Within the tolerance
range
Lower tolerance limit
not reached
Set the display for tolerance range weighing:
In the menu navigate to <2A. LG.> and
select the distinction method (navigation
in the menu: see chap. 8.3)
Bargraph (only for 2 limit values)
In the menu navigate to <2b. r.o.c.> and
select the distinction method (navigation
in the menu: see chap. 8.3)
Data output on external request
 Loading...