Analyzing wavef
orms
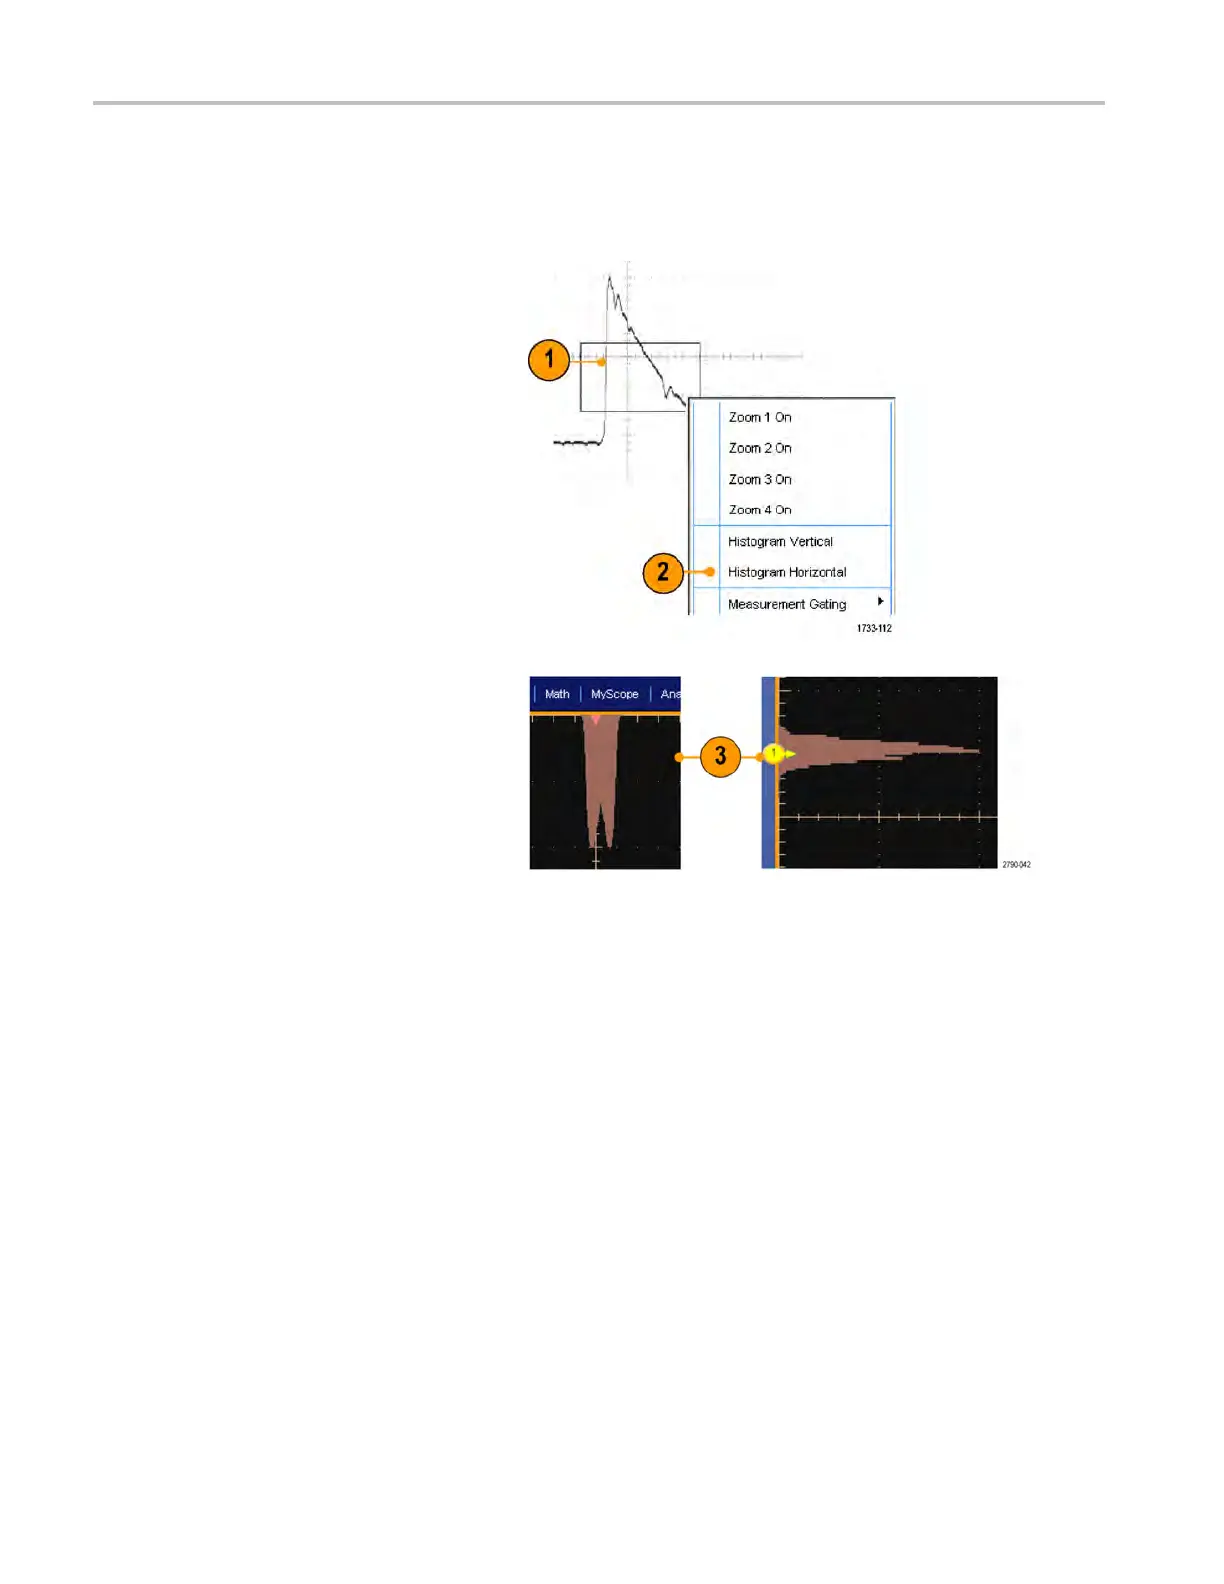
Setting up a histogram
You can display either a v ertical (voltage) or horizontal (time) histogram. Use histogram measurements to get statistical
measurement data for a section of a waveform along one axis.
1. Click and drag the pointer across the
segment of the waveform that you w ant
the histogram to cover. For example,
make the box for a horizontal histogram
wider than it is tall.
2. Select Histogram Vertical or Histogram
Horizontal from the shortcut menu.
3. View the histogram at the top (for
horizontal histograms) or the left edge
(for vertical histograms) of the graticule.
124 MSO/DPO70000DX, MSO/DPO70000C, DPO7000C, and MSO /DP O5000 Series U ser Manual
 Loading...