Video and General Performance Verification
Initial Setup
Use the followi
ng initial setup for all tests unless otherwise specified.
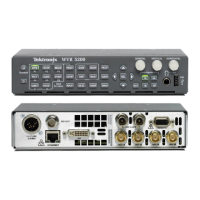
1. Connect the power cord to the rear of the waveform rasterizer.
2. Connect an XGA monitor to rear of instrument.
3. Connect the power cord to the AC mains and allow at least 20 minutes for the
waveform rasterizer to warm up before beginning any procedures.
Signal Source Characterization for Eye Signal Bandwidth
Ver i fiying eye signal bandwidth requires a 75 Ω RF sine wave signal that can be
connected to the 75 (Ω) BNC input, and is either characterized or automatically
leveled. (See page 90.). The results of characterization must be applied at each
measurem
ent frequency, either by adjusting the generator level setting, or by
applying a correction to the amplitude reading from the unit under test.
The meth
od described here uses a 50 Ω generator, 50 to 75 Ω min-loss pad, and
appropriate adapters and cables to connect to the 75 Ω female BNC input of the
unit unde r test. The exact sequence of adapters, min-loss pad, and ca bles is not
critical if correct impedance is maintained in each section, and if the complete
setup is used exactly as characterized when measuring Eye bandwidth.
The absolute signal level should be chosen to give between 750 and 850 mV
p-p
at the reference frequency, as viewed on the unit under test when in Eye BW
check mode. With a setup consisting of a 50 Ω generator, a 5.7 dB min loss pad
and a
ppropriate adapters and cables, a base generator setting of 6.3 dBm normally
gives this result.
Characterization Proc ess
Characterize the test setup as follows to give a table of level setting versus
fr
equency setting for the signal source, resulting in constant signal level at the
connection point to the unit under test.
1. Co
nnect the generator and the required converter, adapters, and cables to
the wideband power detector.
2
.
S
et the generator to the reference frequency, 100 MHz, and the base level,
typically 6.3 dBm.
3. Enter "100 MHz" into the power meter, so it applies the appropriate internal
correction.
4. Record the measured power level as the reference level. (See Table 64.)
5. For each frequency listed, adjust the generator level for a rea ding closest to
the reference level from previous step. Be sure to enter the frequency into the
power meter at each step so that it applies the appropriate internal correction.
Record each generator level setting in the following table.
Waveform Rasterizers Specifications and Performance Verification 7 5
 Loading...