Section 5: Data & Graphs Name
Date
Fundamental Topics in Science © 2001 Texas Instruments
Try-It!™ 5-4
Find a curve to fit the data (cont.)
Obviously, “perfect fit” equations aren’t very practical and often don’t do a good job of predicting
(extrapolating) other data. Therefore, a best-fit curve is often used. Choosing a best-fit curve
with the TI
83 Plus requires these basic steps.
•
You choose a function with a shape that looks similar to the data (beginning with the simpler
curves).
•
The TI
83 Plus uses algorithms to determine the coefficients (a, b, c, and so on) required to
best fit that function to the data.
•
You examine the points and curve visually and numerically to determine how good the fit is.
These three steps can be repeated until you think you have found the right function.
Note:
If you want a refresher on the shapes of these functions, you can return to
DATA & GRAPHS
in
FUNDAMENTAL
TOPICS
. When you return to the
DATA/GRAPHS WIZARD
, repeat the steps beginning with Plot the Data above. (The
values you entered in the lists are still there.)
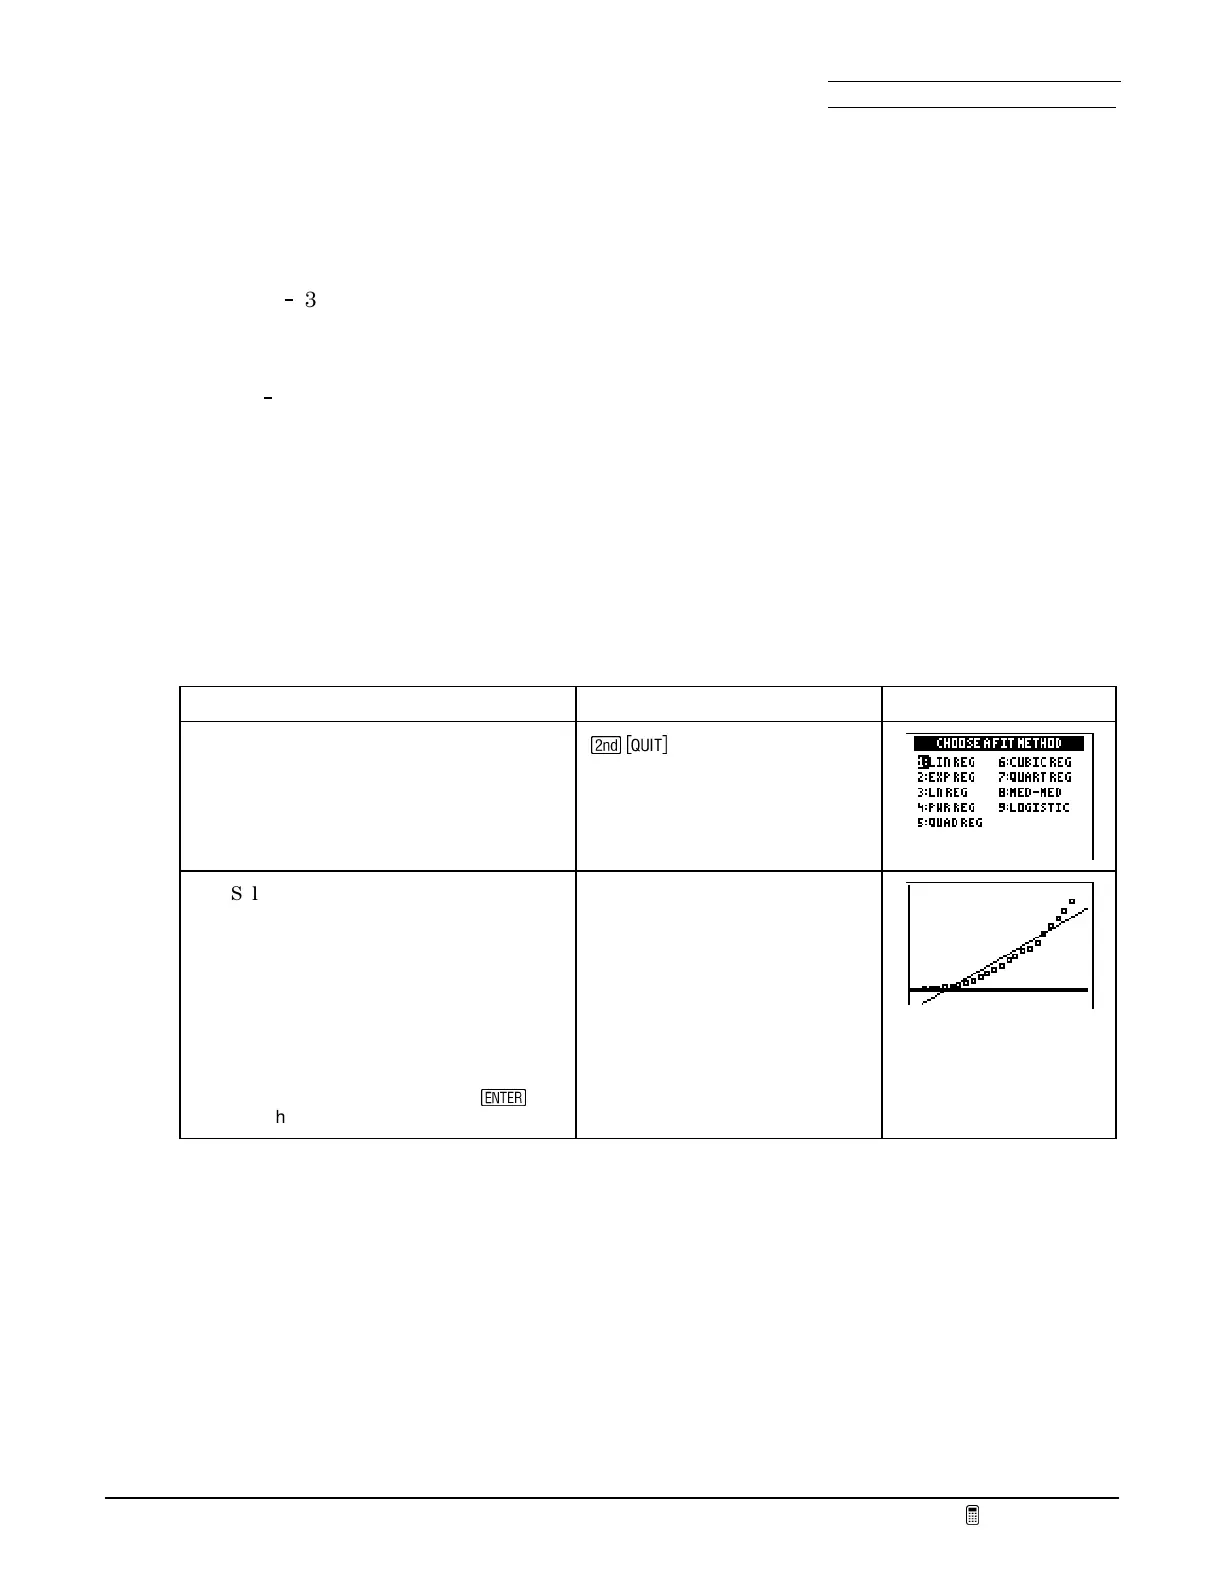
Fit a curve to the data and analyze visually
To Do This Press Display
1. Display the
DATA/GRAPHS WIZARD
screen.
\
2. Select a function to fit. Begin with the
linear function.
Note:
Some types of functions take
longer to calculate, and there may be a
pause before the graph screen replaces
the menu screen.
Note:
If a function is inappropriate for a
set of data, the message
FIT ERROR
will
display below the menu. Press
¯
and choose a new function.
1:LIN REG
Describe how well the linear function fits the points. What is “wrong” with the fit? How well do
you think it would predict population in 200 years?
#
 Loading...


