22 M4M 30 NETWORK ANALYZER USER MANUAL
5.4.Overview of menu pages
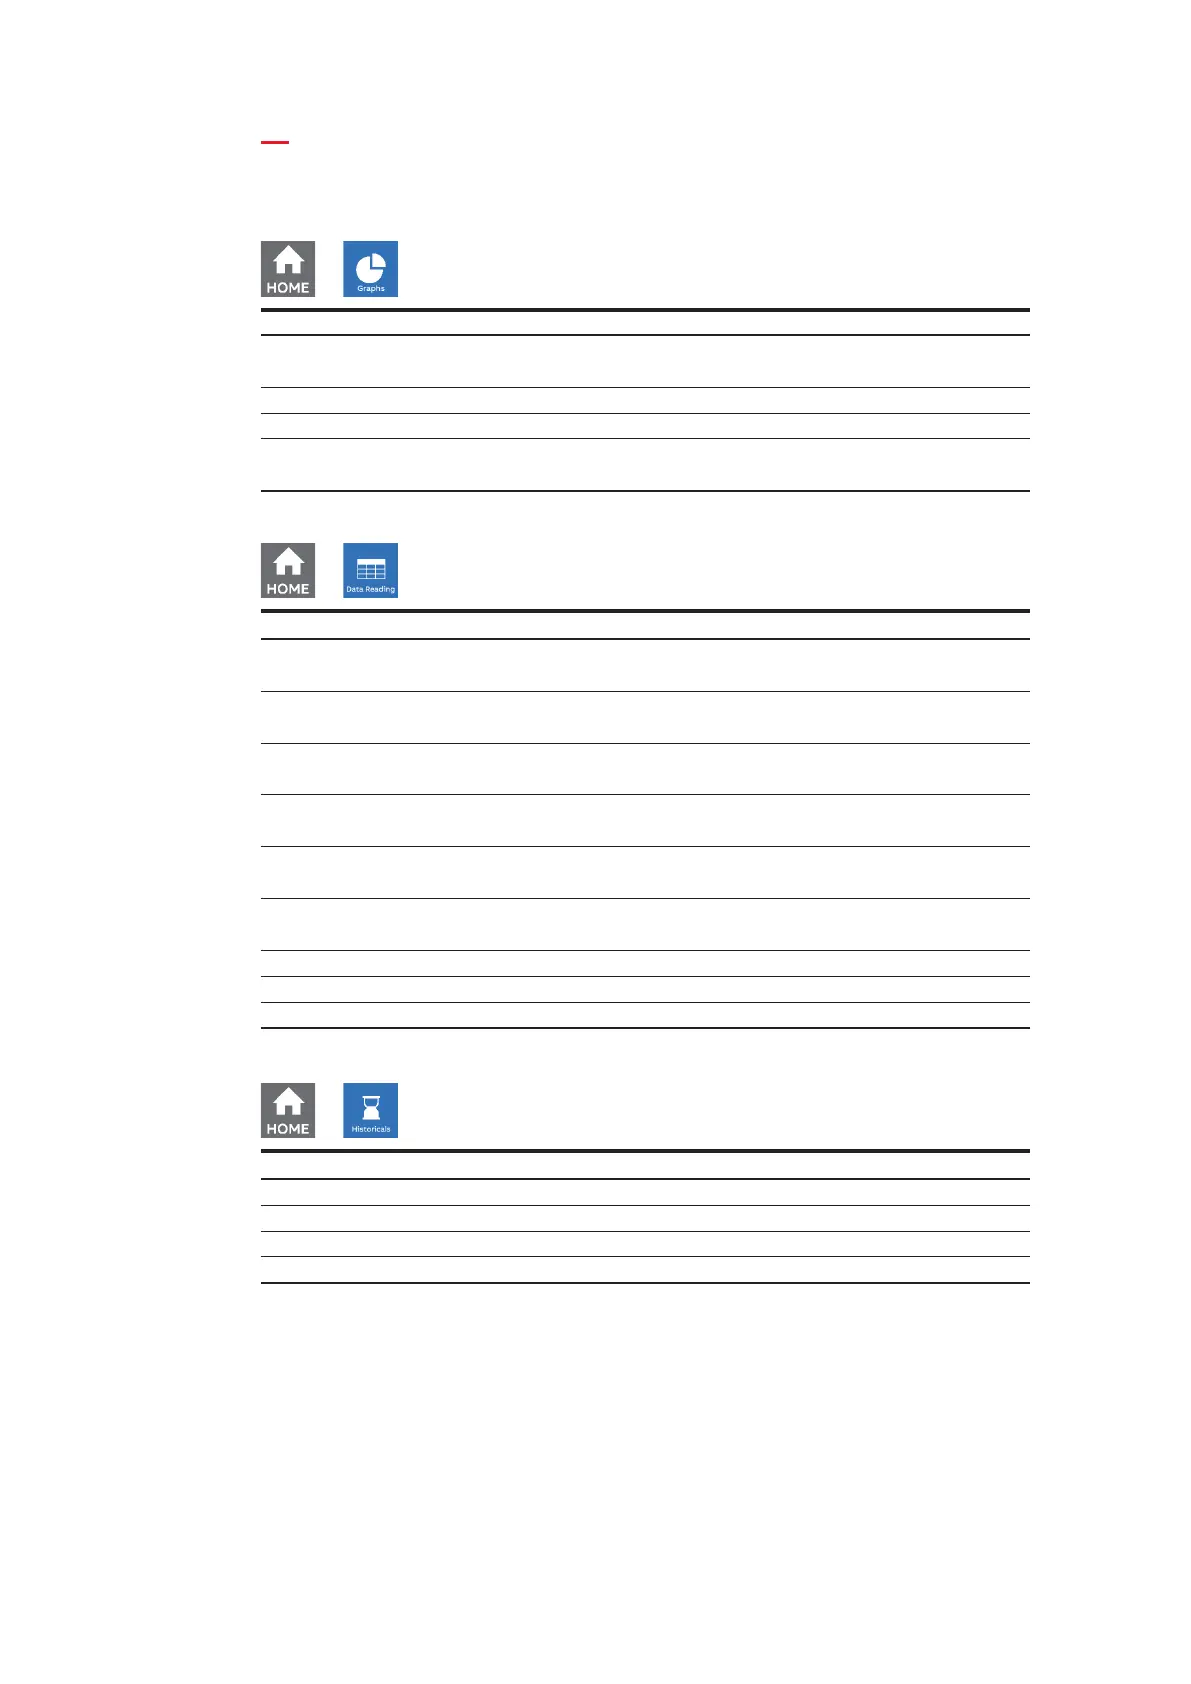
Each section of the device contains different menus and submenus as per below tables:
→
Menu Description
Realtime Graphs
Bargraphs for voltage (L-N, L-L), current, power (active, reactive,
apparent).
Waveforms Waveforms visualization for voltage (L-N, L-L), current.
Harmonics Harmonic composition of voltage (L-N, L-L), current.
Phasors
Phasor diagram for voltage L-N and current and visualization of
displacements.
→
Menu Description
Realtime
Summary, voltage (L-N, L-L), current, power (active, reactive,
apparent), frequency.
Energy
Active, reactive, apparent energy, import, export and net, including
tariffs if defined.
Power quality
THD (voltage, current), unbalances (voltage, current), power factor
and cosphi per each phase.
Average
Average values in the latest period for voltage, current and power
(active, reactive, apparent).
Min value
Minimum values forvoltage, current and demand power (active,
reactive, apparent).
Max value
Maximum values for voltage, current and demand power (active,
reactive, apparent).
I/O I/O status according to the I/O type and M4M version.
Notifications List of notifications divided into alarms, warnings, errors.
Timers Count-up timer (on hours), count-down timer (maintenance timer).
→
Menu Description
Load profile Stored load profiles and trends associated to realtime parameters.
Max/Min Demand Stored max/min demand values (up to 3 each) of realtime parameters.
Energy - Trend Trend of energy consumption values over a certain period
Energy - Snapshots Instantaneous snapshots of energy consumption cumulative values

 Loading...