27
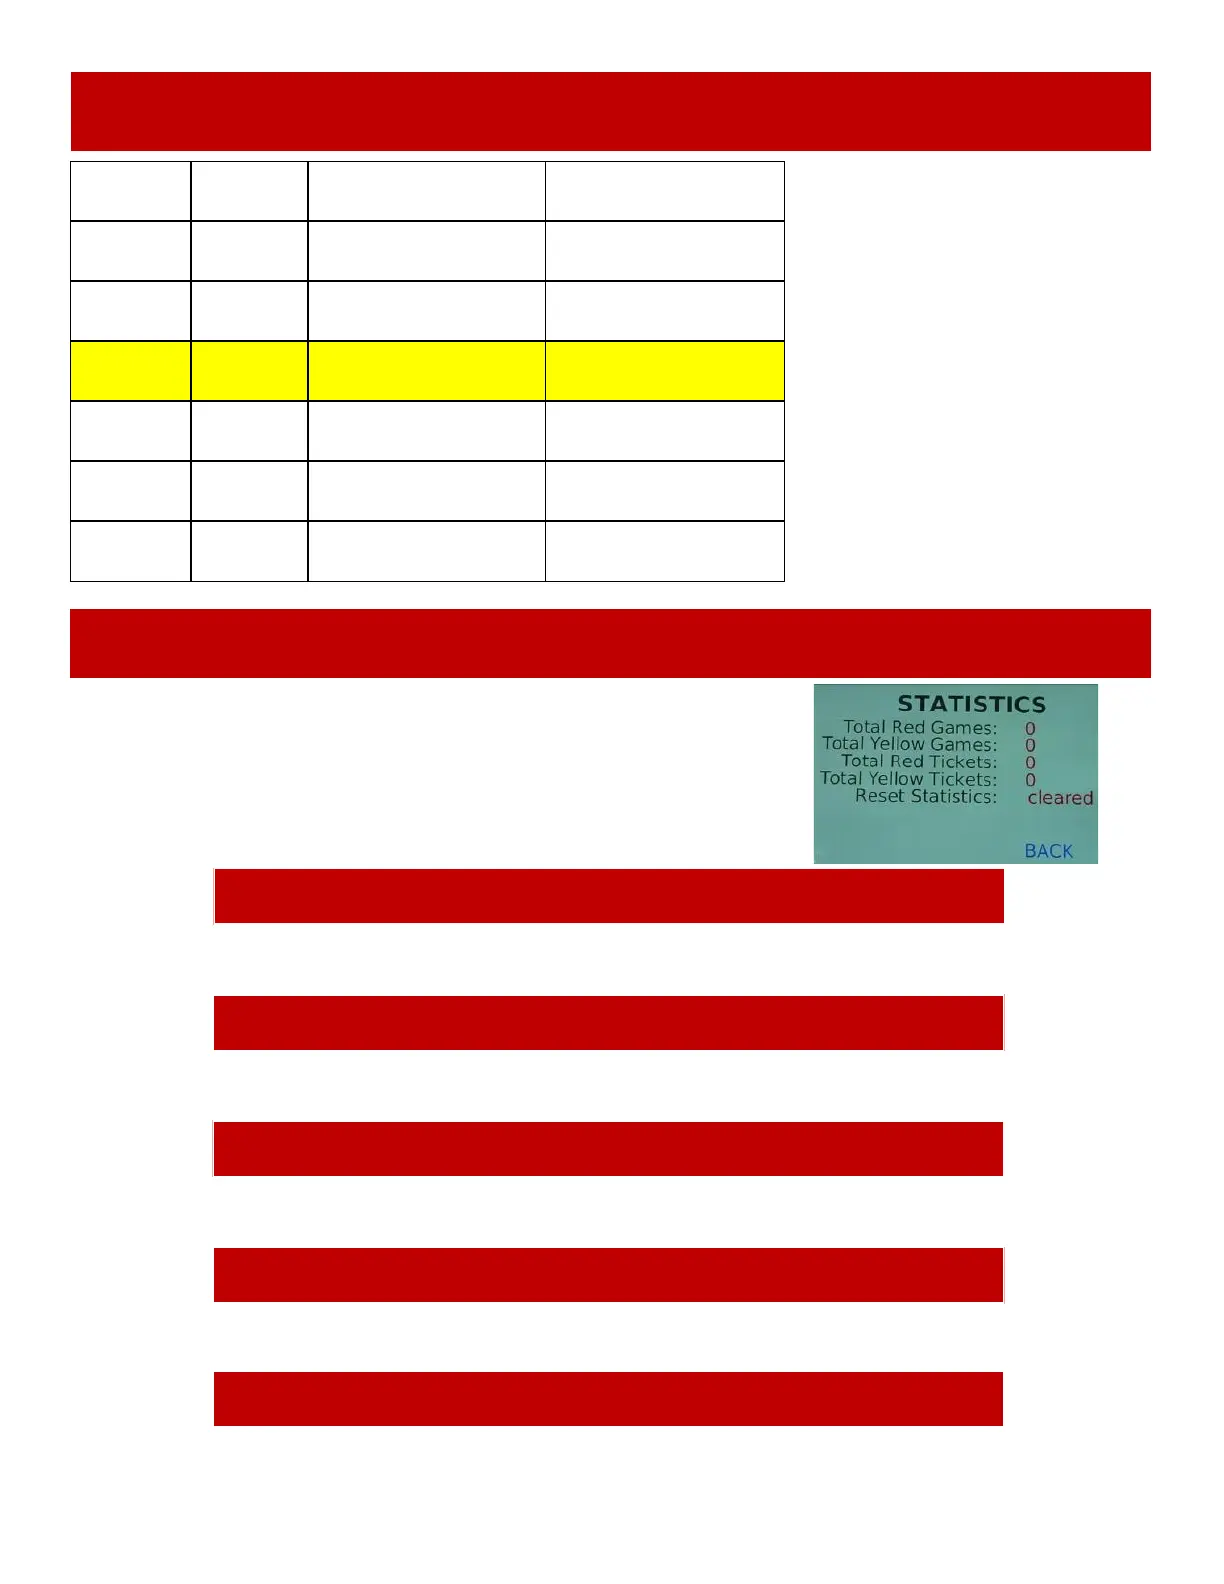
STATISTICS
TOTAL YELLOW GAMES
Shows the total number of Yellow (right side) games played.
Scroll through the options by pressing the “MENU” button.
Change selection with the “SELECT” button.
Scroll to “BACK” and press the “SELECT” button to go
back to the main menu.
Default settings are highlighted in yellow below.
TOTAL RED TICKETS
Shows the total number of Red (left side) tickets dispensed.
TOTAL RED GAMES
Shows the total number of Red (left side) games played.
RESET STATISTICS
Press the “SELECT” button 3 times to reset statistics.
TOTAL YELLOW TICKETS
Shows the total number of Yellow (right side) tickets dispensed.
TICKET PATTERNS
WINNER
TICKETS
LOSER
TICKETS
AVERAGE TICKETS
PER GAME
PRICE PER PLAY
20 10 14-16 $.50 PER PLAY
50 20 34-36 $1.00 PER PLAY
100 20 48-52 $1.50 PER PLAY
110 30 68-72 $2.00 PER PLAY
140 40 88-92 $2.50 PER PLAY
160 50 100-110 $3.00 PER PLAY
These are estimates of Average
Tickets per Game using the
shown ticket values for
game winner and game loser.
Change ticket values in the
“Payout Settings” menu to
change your individual payout
percentages.

 Loading...