4 Web-based Switch Configuration D-Link Smart Managed Switch User Manual
118
SNMP Trap – Indicates that the event is a trap.
Log and Trap – Indicates that the event is both a log entry and a trap.
Community: Specifies the community to which the event belongs.
Owner: Specifies the time that the event occurred.
Click Add to add a new RMON event.
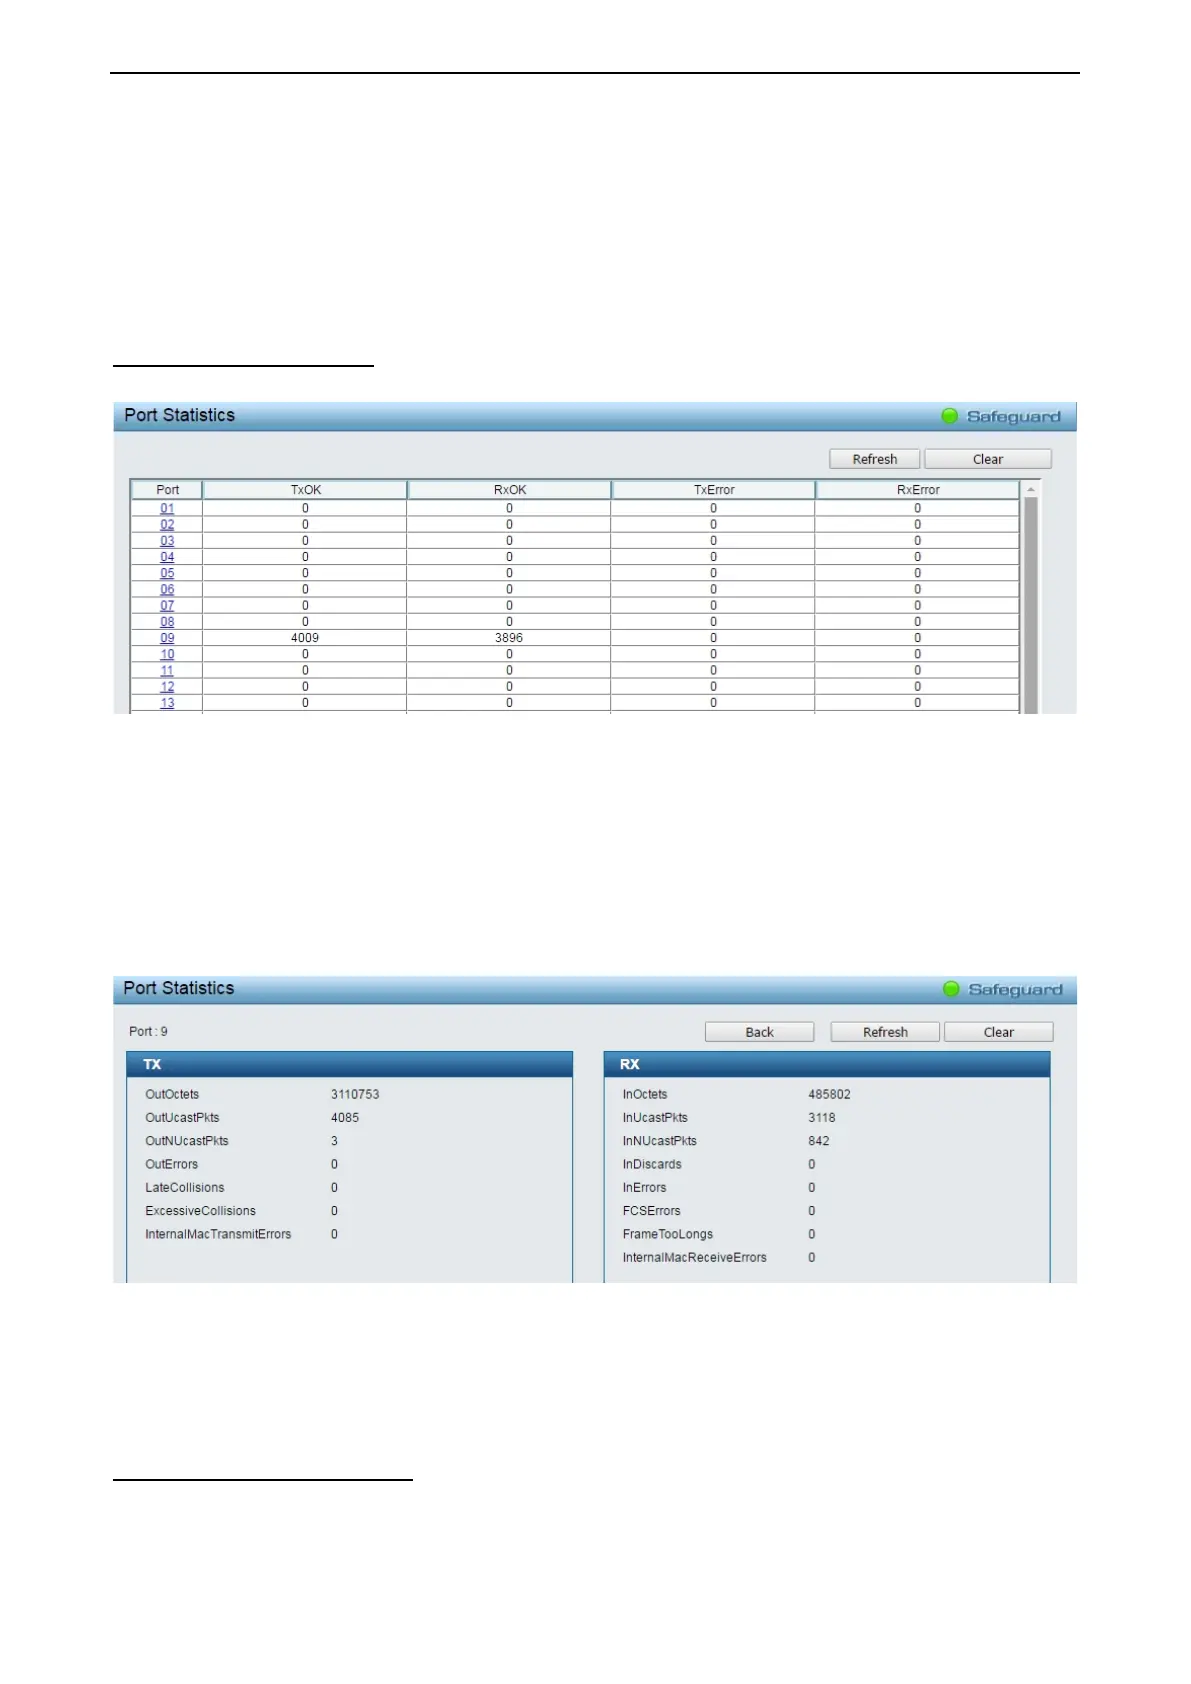
Monitoring > Port Statistics
The Port Statistics screen displays the status of each port packet count.
Figure 4.152 – Monitoring > Port Statistics
Refresh: Renews the details collected and displayed.
Clear: To reset the details displayed.
TxOK: Number of packets transmitted successfully.
RxOK: Number of packets received successfully.
TxError: Number of transmitted packets resulting in error.
RxError: Number of received packets resulting in error.
To view the statistics of individual ports, click one of the linked port numbers for details.
Figure 4.153 – Monitoring > Port Statistics
Back: Go back to the Statistics main page.
Refresh: To renew the details collected and displayed.
Clear: To reset the details displayed.
Monitoring > Cable Diagnostics
The Cable Diagnostics is designed primarily for administrators and customer service representatives to
examine the copper cable quality. It rapidly determines the type of cable errors occurred in the cable.
 Loading...