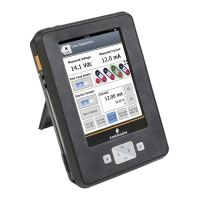
113
Charts Charts display a graphic view of variables as they occur over time.
There are four major types of charts:
• Strip/sweep/scope - Displays variable data with an x-axis of time.
A strip chart continually updates the chart, scrolling from right to left.
A sweep chart paints the window from left to right, and then paints
the window from left to right again, overwriting the oldest data. A
vertical line is used to separate the old and new data. When the data
reaches the right edge of the screen, the data is then plotted from
the left edge of the screen and the x-axis is updated.
A scope chart paints the window from left to right. When the data
reaches the right edge of the screen, the screen is cleared and the
x-axis is updated.
• Horizontal bar - Displays data represented as bars from left to right.
• Vertical bar - Displays data represented as bars from bottom to top.
• Gauge - Displays a gauge chart, similar to an analog car
speedometer.
NOTE
If a chart is displayed for an extended time period, the 475 Field
Communicator will have decreased response time due to the large
number of data points in the chart.
Strip/sweep/scope charts
The strip/sweep/scope chart formats device data into a line chart that
displays device data over time. The labels and axis displayed are
determined by the device manufacturer. Use the drop-down list to
select the variable you want to highlight. The selected variable is
displayed as a bold, solid colored line. Other variables that share the
same source or same Y-axis appear as thin colored lines on the chart.
Variables that do not share the same axis as the selected variable
appear as dashed, colored lines. The colors displayed are determined
by the device description and may vary between devices.
A vertical line may be displayed in the chart to distinguish between the
old and new data. The vertical line advances as new data is displayed.
For the sweep and scope charts, the pan, zoom-in, zoom-out, and
reset affect only the Y-axis.
The time shown on the x-axis starts at the time the chart starts. The
chart update rate is determined by the device manufacturer. The
default chart update rate is 1 second.
 Loading...