116
Figure C-6. Gauge chart example
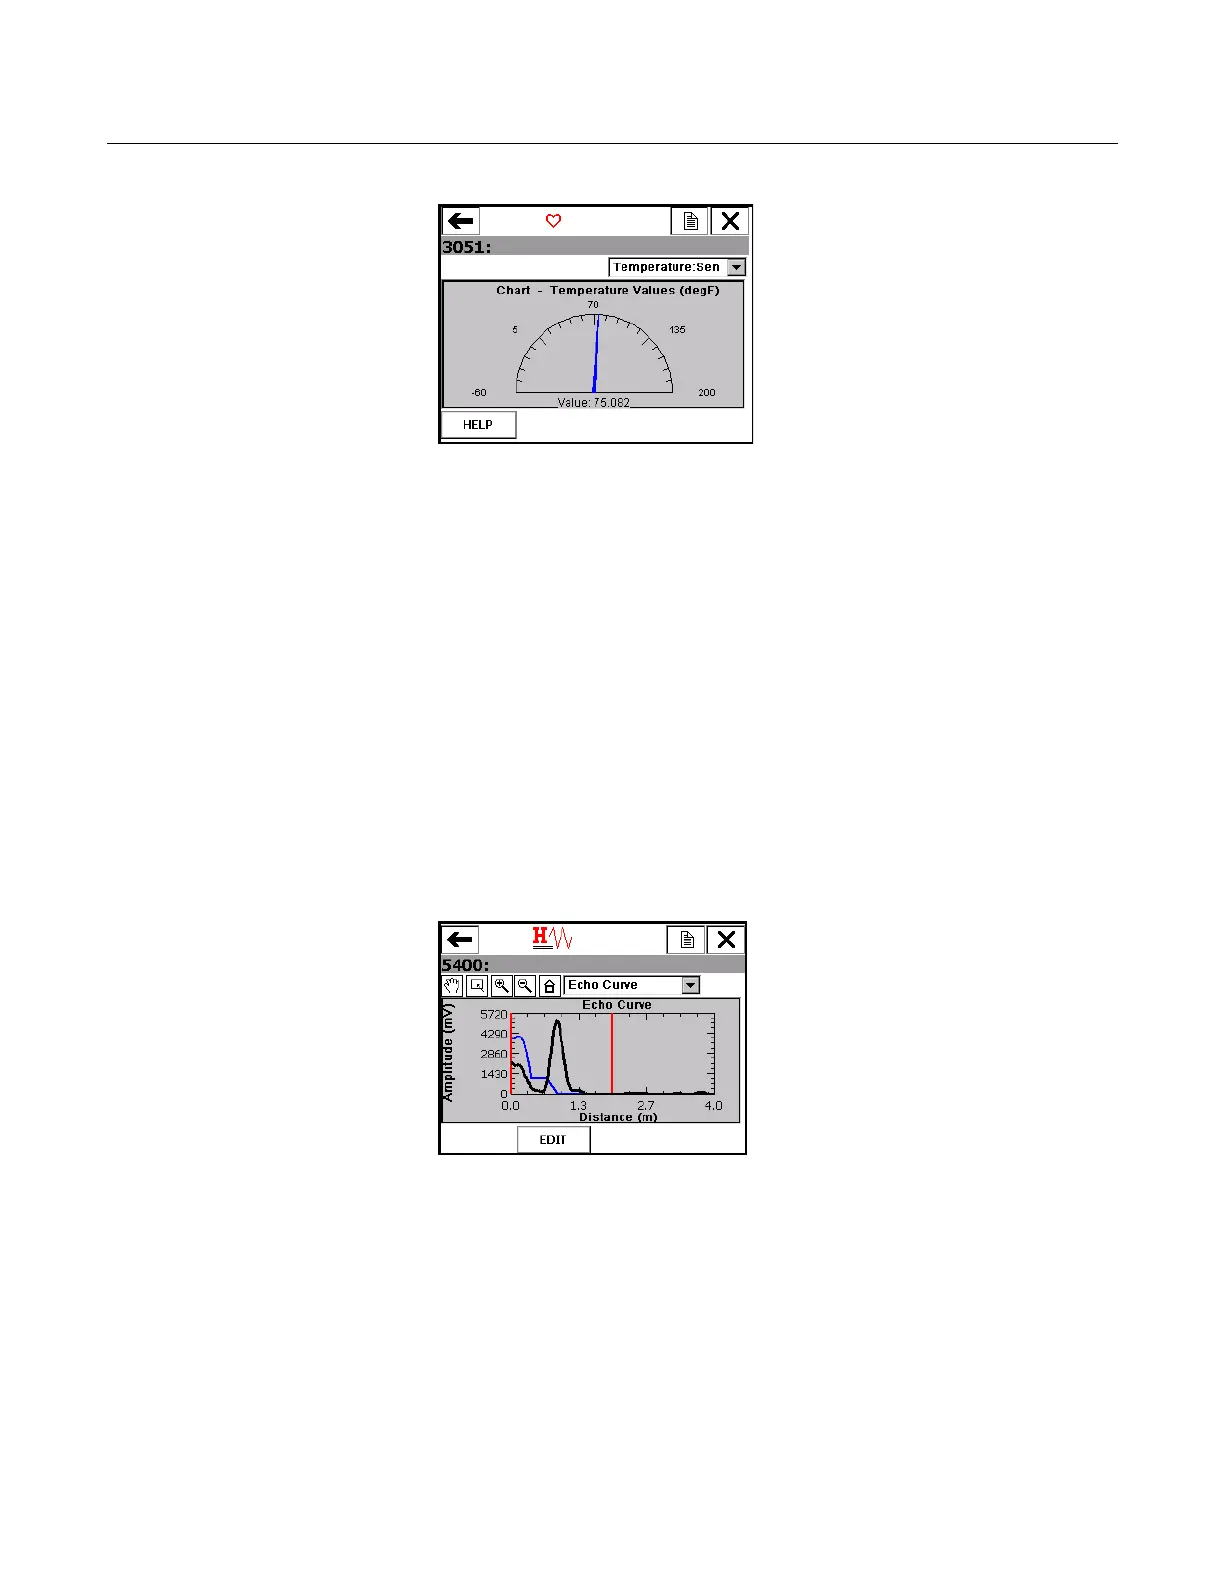
Graphs A graph is a snapshot line drawing of device information. Use the
drop-down list to select the variable you want to highlight. Additional
variables may be present if more than one is defined for the option
selected in the drop-down list. The selected variable from the
drop-down list appears as a bold, solid colored line while the other
variables with the same Y-axis appear as thin colored lines. The colors
displayed are determined by the device description and may vary
between devices. Variables that do not share the same Y-axis as the
selected variable appear as dashed, colored lines. The labels and axis
displayed are determined by the device manufacturer.
You may also see symbols such as squares or triangles on some
variables.
These show keypoints that indicate the important values on
a graph. If more than seven variables are on the graph, “+” symbols
are displayed for the keypoints.
Figure C-7. Graph example
 Loading...