NOTE: Ground contact time and balance are not
available while walking.
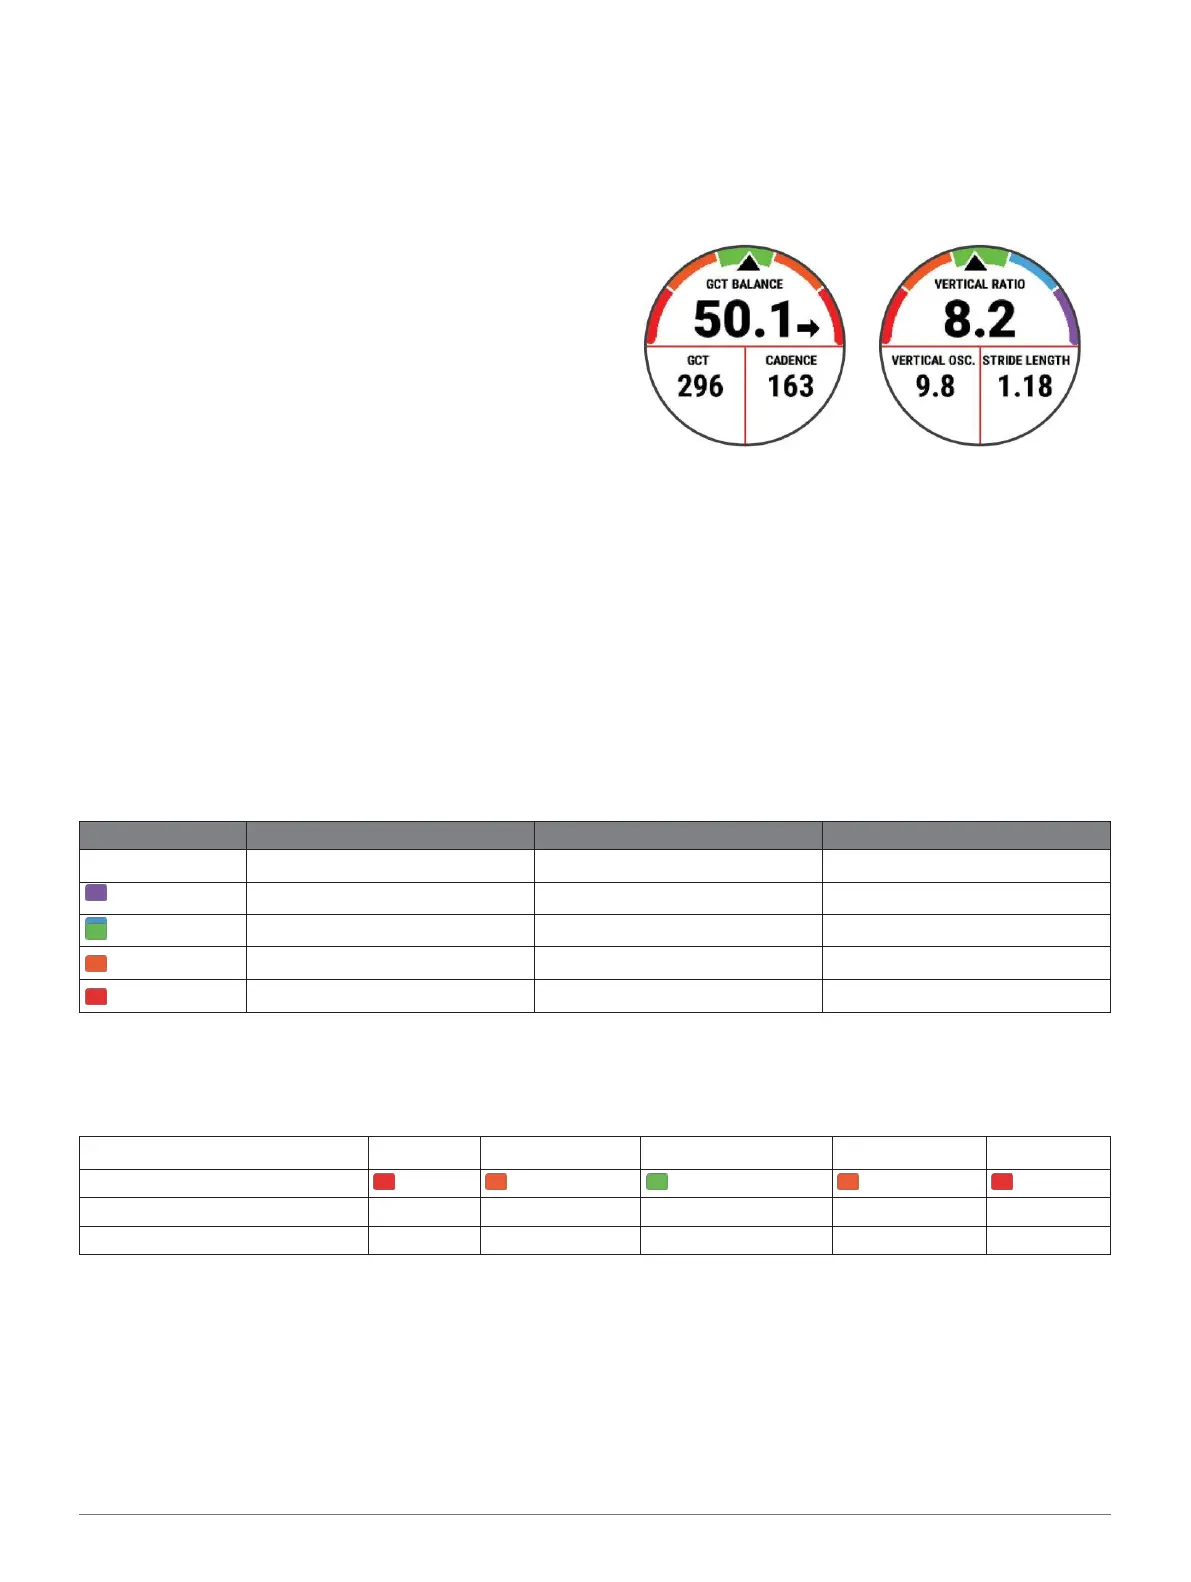
Ground contact time balance: Ground contact time
balance displays the left/right balance of your
ground contact time while running. It displays a
percentage. For example, 53.2 with an arrow
pointing left or right.
Stride length: Stride length is the length of your stride from
one footfall to the next. It is measured in meters.
Vertical ratio: Vertical ratio is the ratio of vertical
oscillation to stride length. It displays a percentage.
A lower number typically indicates better running
form.
Training with Running Dynamics
Before you can view running dynamics, you must put on an
HRM-Pro, HRM-Run, or HRM-Tri accessory, or the
Running Dynamics Pod, and pair it with your device
Color Gauges and Running Dynamics Data
(Pairing Your Wireless Sensors, page 37).
1 Select START, and select a running activity.
2 Select START.
3 Go for a run.
4 Scroll to the running dynamics screens to view your
metrics.
5 If necessary, hold UP to edit how the running
dynamics data appears.
The running dynamics screens display a color gauge for the primary metric. You can display cadence, vertical oscillation,
ground contact time, ground contact time balance, or vertical ratio as the primary metric. The color gauge shows you how
your running dynamics data compare to those of other runners. The color zones are based on percentiles.
Garmin has researched many runners of all different levels. The data values in the red or orange zones are typical for less
experienced or slower runners. The data values in the green, blue, or purple zones are typical for more experienced or faster
runners. More experienced runners tend to exhibit shorter ground contact times, lower vertical oscillation, lower vertical ratio,
and higher cadence than less experienced runners. However, taller runners typically have slightly slower cadences, longer
strides, and slightly higher vertical oscillation. Vertical ratio is your vertical oscillation divided by stride length. It is not
correlated with height.
Go to www.garmin.com/performance-data/running/ for more information on running dynamics. For additional
theories and
interpretations of running dynamics data, you can search reputable running publications and websites.
 Loading...