Front Panel Operation
2-98
ACI, and in-circuit current because other information is dis-
played in its place.) While the limits bar graph is displayed,
the programmed values for limit set #1 can be viewed by
pressing INFO.
The digital output lines can be programmed to reflect the re-
sults of limit tests. The first test that fails sets a programma-
ble digital output pattern, where the test execution order is
LOW1, HIGH1, LOW2, HIGH2. If all tests pass, another
programmable pattern is set. (Also see DIGITAL I/O in para-
graph 2.12.7.)
LIMIT-SET-1 and LIMIT-SET-2
These menu items are similar in that you can enable or dis-
able either or both limit sets, and program the high and low
limit values for either or both limit sets.
The options for these menu items are explained as follows:
CONTROL: This item enables or disables control of the dig-
ital output lines by the results of either or both limit set tests.
For example, to let limit set #1 control the digital output
lines, highlight the CONTROL item in the previous menu
and press ENTER. Then highlight the ENABLE item in the
next menu and press ENTER. The instrument returns to the
LIMIT SET #1 MENU.
LOLIM1, HILIM1, LOLIM2, HILIM2: These items allow
you to set values for the low and high limits, and the action
performed on the digital output lines for each limit test
failure.
After selecting a limit, the value for that limit will be dis-
played. To change the limit, use the cursor keys and the range
keys to display the desired value. Note that you must enter
values in scientific notation.
Press ENTER to select your value and display the next menu
which selects the digital output action to be taken if the
selected limit is the first limit to be exceeded. The digital out-
puts can be toggled between ON and OFF with the range
keys.
Each measurement function except frequency has a multiple
display for the limits bar graph. It shows a pass/fail indica-
tion and a graphical representation of the reading compared
to limit set #1. (Note: PASS/FAIL indication is not available
on ACV, ACI, and in-circuit current.) If low limit #1 is less
than high limit #1, you will see a display similar to that
shown in Figure 2-34.
Note that the Model 2002 does not check the validity of the
high and low limit values when you enter them. If low limit
#1 is greater than or equal to high limit #1, the following
message is shown on the bottom line of the limits bar graph
next display:
No bar graph: LLIM1 >= HLIM1
The programmed values for limit set #1 are shown by press-
ing the INFO key from the limits bar graph next display.
STROBE-CONTROL
This menu item enables or disables the use of digital output
#4 as a binning strobe signal.
If enabled, the strobe signal is set TRUE for greater than 10
microseconds after all limit tests have been performed on a
new reading. The FALSE to TRUE transition can be used to
trigger an external device handler to check digital outputs
#1-3 for sorting parts into bins.
When binning is enabled from the front panel or with the bus
command :CALCulate3:BSTRobe:STATe ON, the binning
strobe signal is set to FALSE. When binning is disabled, the
strobe signal is left unchanged.
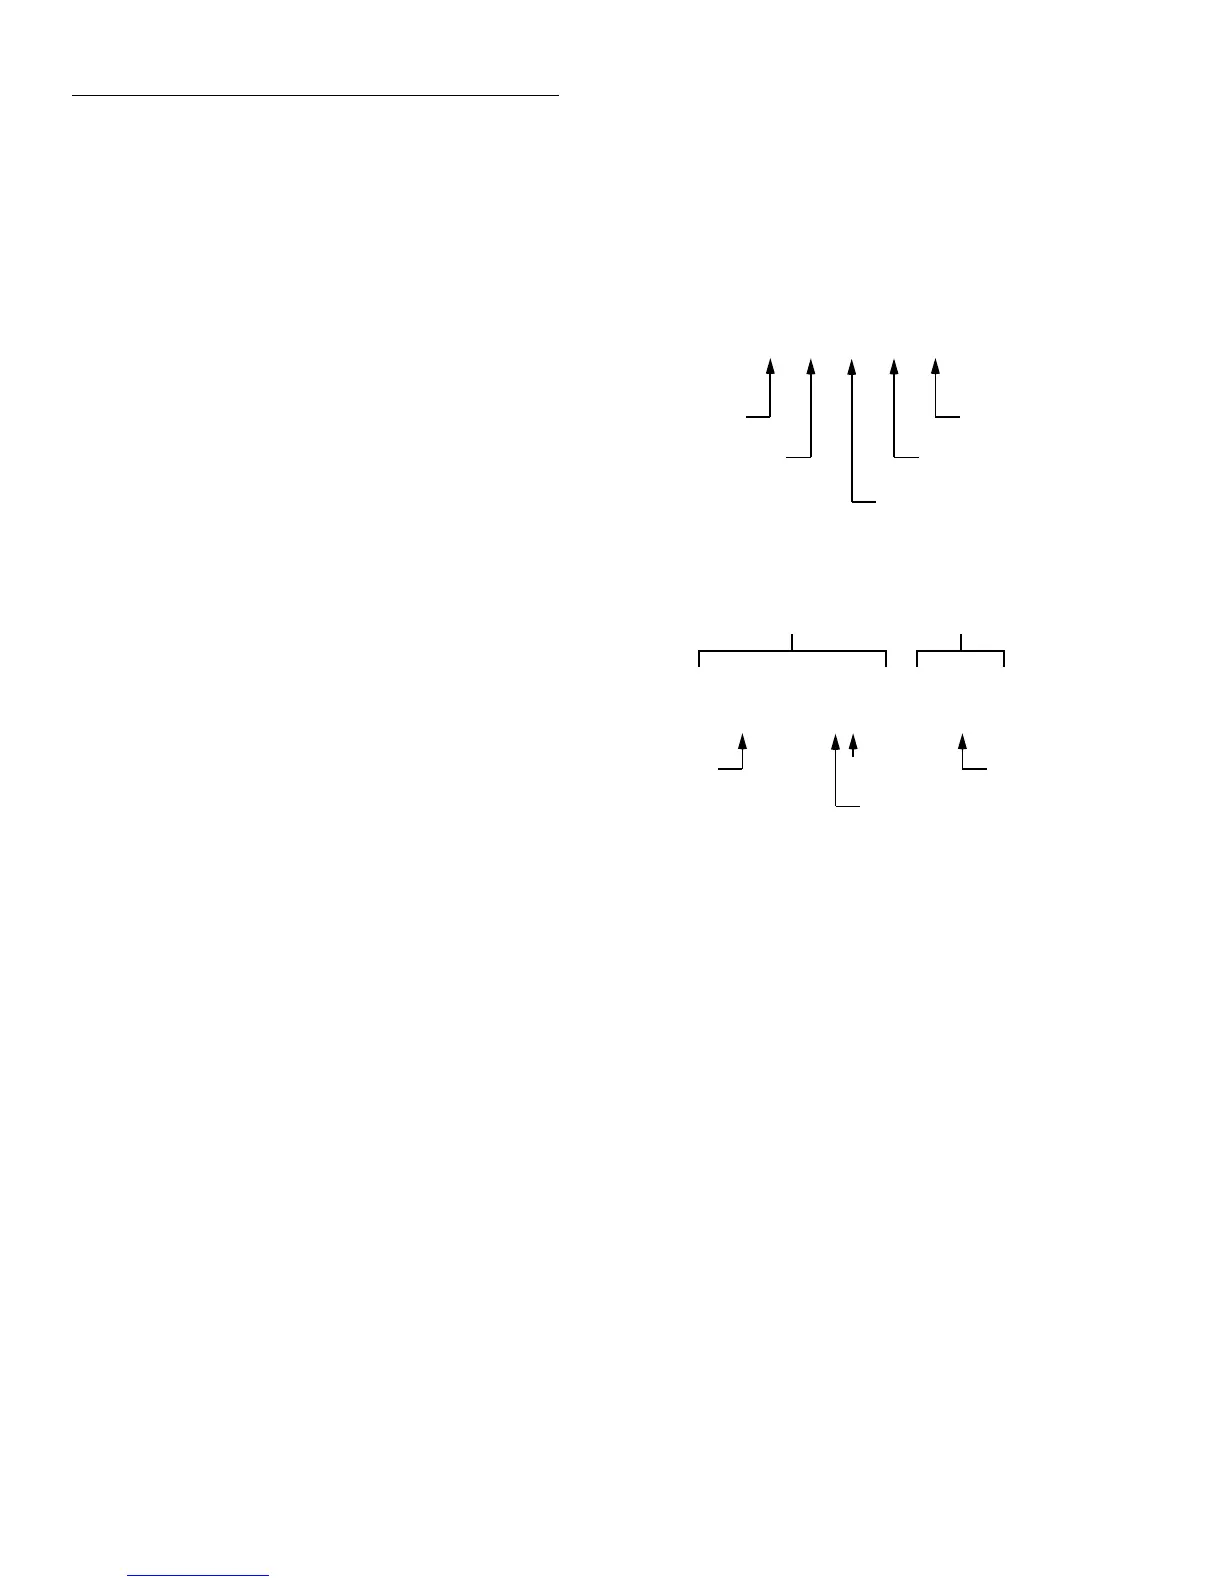
Figure 2-34
Limits bar graph example
LLIM1 | | | | | HLIM1
Low Limit #1
Average of midpoint
and Low Limit #1
High Limit #1
Average of midpoint
and High Limit #1
Midpoint of Low Limit #1
and High Limit #1
A. Defined points of display
Reading Pass/Fail indication
-000.2836 VDC PASS
NOTES : 1. Press INFO to view the programmed Low Limit #1 and
High Limit #1 values.
2. Multiple display of limit values do not use unit prefixes
(i.e., volts not millivolts).
B. Example Display with Limits = ±1V
-1V
LLIM1 | | ===| | | HLIM1
1V
0V
30% of difference between
midpoint and Low Level #1