Motorola Confidential Proprietary
Manual Test ProceduresLevel 3 Service Manual
2-7
Draft 1.0
7. Wait until the phone indicates a signal
8. Dial a number from the phone and press the
send button.
9. The phone is now connected.
WCDMA Call Test Parameters
While the phone under test is in an active call, the pa-
rameters for each band should be verified as described.
Figure 2-8. TPC Pattern Type(UE Signal)
Figure 2-9. WCDMA Call Connected
¹Refer to Figure 10
²Refer to Figure 11
³Refer to Figure 12
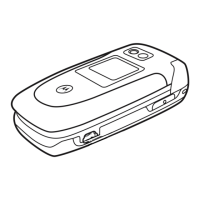
Table 2-5. WCDMA Call Parameters
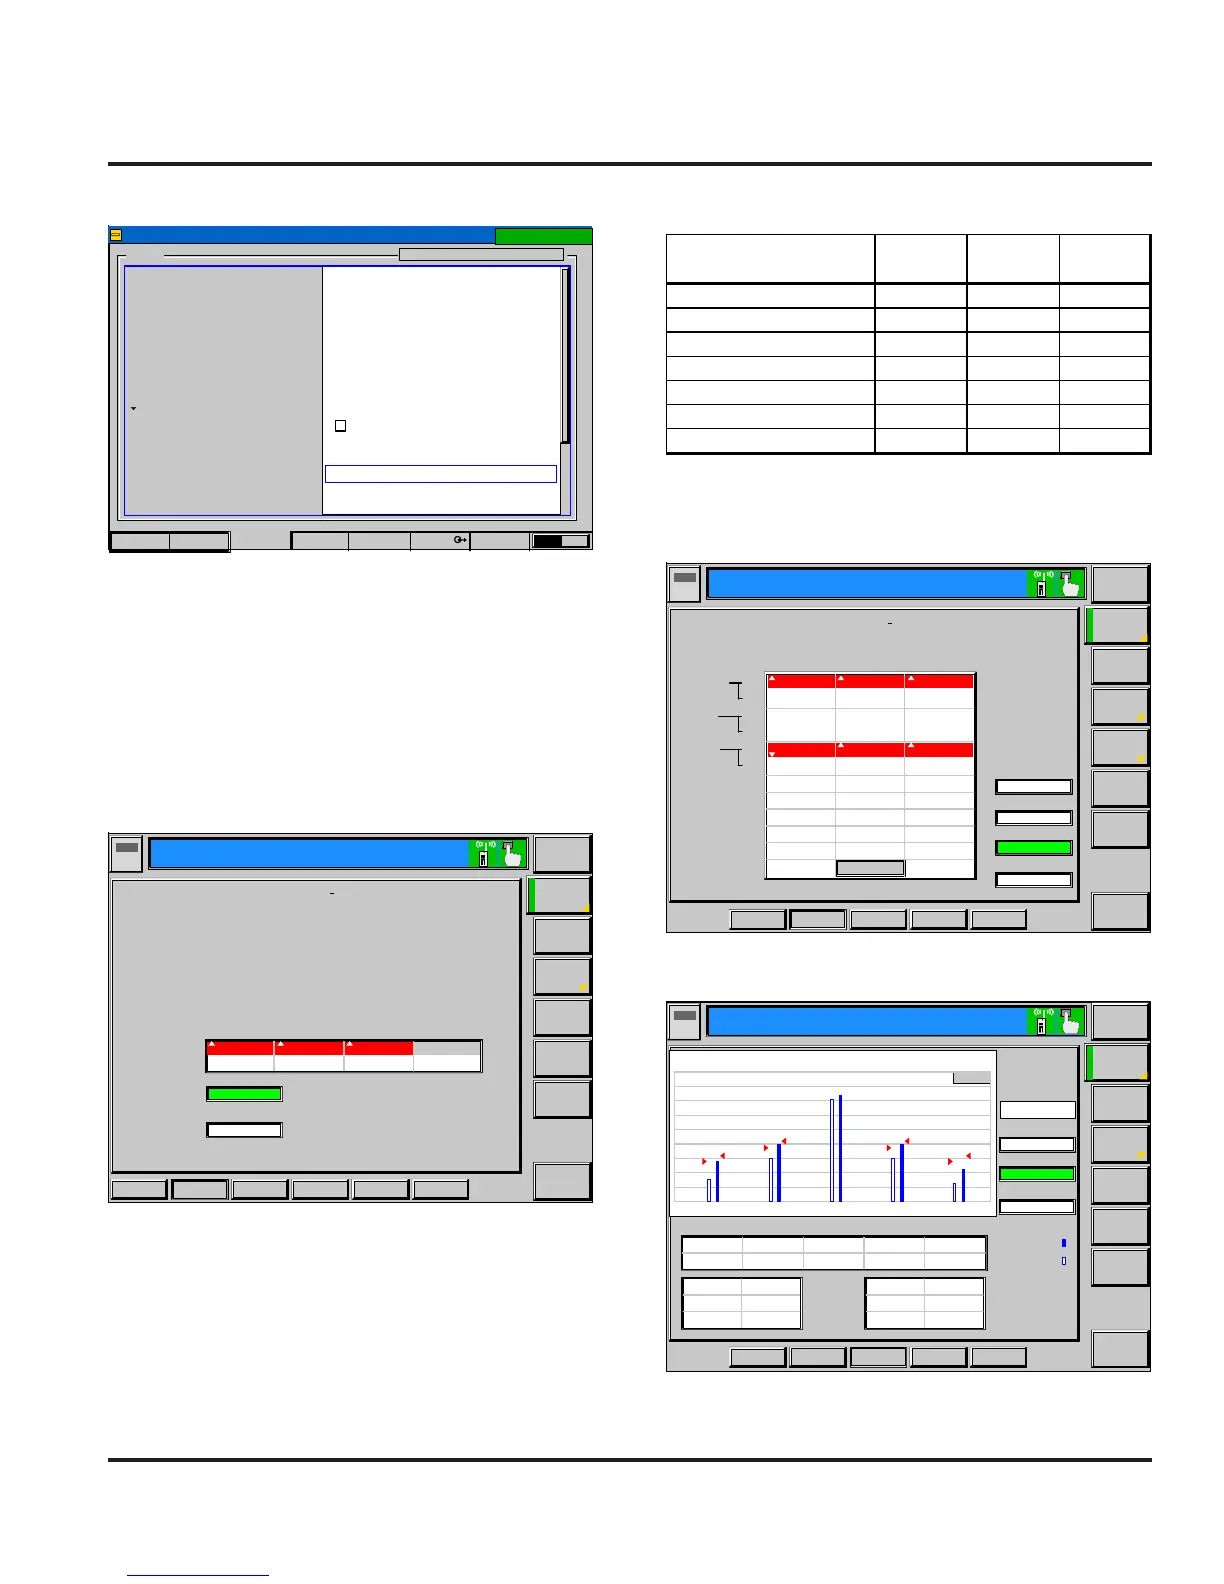
Figure 2-10. WCDMA Modulation
Figure 3-11. ACLR Screen
Signal On
Setup
UE Signal Sync.RFNetwork 21BS SignalConnection
PICH
PICHChannelCode
AICH
AICHChannelCode
DPDCH
DPCH ChannelCode
PowerOffset(DPCCH/DPDH)
Secondary Scrambling Code
-3.0
dB
6
TPC Settings/TPC Pattern Type
WCDMA Connection Control
FDD
TPC Settings
DefaultSettings
TPC Algorithm
TPCStepSize
TPC Pattern Type
Pattern
Repeat Pattern
-5.0
dB
3
-7.0
dB
6
0.0
dB
1
Algorithm 2
1
dB
All1
0000000000000000000000
bin
Off
Parameter
Low
Limit
High
Limit
Unit
Avg. RMS Power Out¹ 20.5 21.5 dBm
Avg. Frequency Error² -195 195 Hz
Avg. RMS EVM² 0 13.5 %
Avg. RMS ACLR - 2³ -100 -43 dB
Avg. RMS ACLR - 1³ -100 -33 dB
Avg. RMS ACLR + 1³ -100 -33 dB
Avg. RMS ACLR + 2³ -100 -43 dB
Appli-
cation
Menus
Connect
Control
Overview
WCDMA
Analyzer
Lev.
Max. Level:+ 30.0 dBm Low Noise Freq/Offset: + 0.000kHz: Chan. /Freq: 9750/ 1950 MHz
R
U
N
Ch. 2
Ch. 1
Receiver
Quality
Power Modulation Spectrum
Trigg
UE Signal
BS Signal
Level
BS Signal
Settings
Receiver
Quality
Code Dom.
Power
ScrCode0
ErrVectMagn
MultipleSignal DPCCH+DPDCH 1 SR1 15
20.8
%
StatisticCount
Out of Tolerance
10
100.00 %
WCDMA
FDD Modulation
Band
I
Ana. Set
SlotNumber
0
UE Power
20.81 dBm
22.16
%
26.5
%
8.5
%
8.80
%
10.2
%
15.3
%
14.03
%
15.3
%
5.6
%
5.52
%
5.6
%
-11.5
°
12.47
°
15.4
°
3.7
°
3.95
°
4.9
°
-33.06
dB
- 32.95
dB
- 32.37
dB
-21.74
dB
- 21.38
dB
- 20.07
dB
5
Hz
4
Hz
-76
Hz
0.9929 0.99226 0.9897
-29.11
dB
- 28.12
dB
- 25.49
dB
Q1 I0
MagnError
PhaseError
I/QOriginOffset
I/QImbalance
CarrierFrequency Error
WaveformQuality
PeakCode Dom Error
PCDE Code
Peak
RMS
Peak
RMS
Peak
RMS
Current Average Max /Min
CC1 64CCMode Manual
Appli-
cation
Menus
Connect
Control
ACLR
Filter
Analyzer
Lev.
dBm Max. Level:+ 30.0 dBm Low Noise Chan./Freq: 9750 / 1950 MHz
R
U
N
Ch. 2
Ch. 1
Receiver
Quality
Power Modulation Spectrum
Trigg
BS Signal
Level
BS Signal
Settings
Receiver
Quality
Code Dom.
Power
Freq. Offset:+ 0.000kHz
StatisticCount
Out of Tolerance
10
100.00 %
WCDMA
FDD Spectrum
Band
I
Meas.Length
640
Chip
UEPower
----
+24.7
dBm
ACLR (Peak) Curr.
Analyzer
Settings
- 10.00 MHz - 5.00 MHz 0 MHz + 5.00 MHz +10.00 MHz
+20.7
dBm
-34.9-47.4 - 34.7 - 51.4
-41.5-55.7 - 41.3 - 57.8
-41.5-55.7 - 41.3 - 57.8
-34.6-45.1 - 33.7 - 49.0
-41.3-55.2 - 41.0 - 57.4
ACLR (RMS) Curr.
ACLR (RMS) Avg.
ACLR (Peak)Avg.
ACLR (RMS) Max.
All
Values
in
dB
+40
+30
+20
+10
+0
-10
-20
-30
-40
-50
-2 -1 0 1 2 Ch
Current
Appli-
cation
Menus
Connect
Control
Maximum
Power
Overview
Analyzer
Lev.
Max. Level:+ 30.0 dBm Low Noise Freq/Offset: + 0.000kHz: Chan. /Freq: 9750/ 1950 MHz
R
U
N
Ch. 2
Ch. 1
Receiver
Quality
Power Modulation Spectrum
Trigg
Analyzer
Settings
BS Signal
Level
BS Signal
Settings
Receiver
Quality
Code Dom.
Power
UE Power(Peak)
UE Power(RMS)
Current Average Maximum Minimum
24.77
dBm
24.73
dBm
24.94
dBm
24.02
dBm
24.01
dBm
24.09
dBm
20.69
dBm
Statistic Count
Out of Tolerance
10
100.00 %
WCDMA
FDD Power
Band
I
Figure 2-11. ACLR Screen
WCDMA Call Processing
 Loading...