Front-Panel Operation
Using the Analyze Functions 3
3-15
plot point. Previously laid down plot marks are adjusted down in size proportionally to
the new vertical axis.
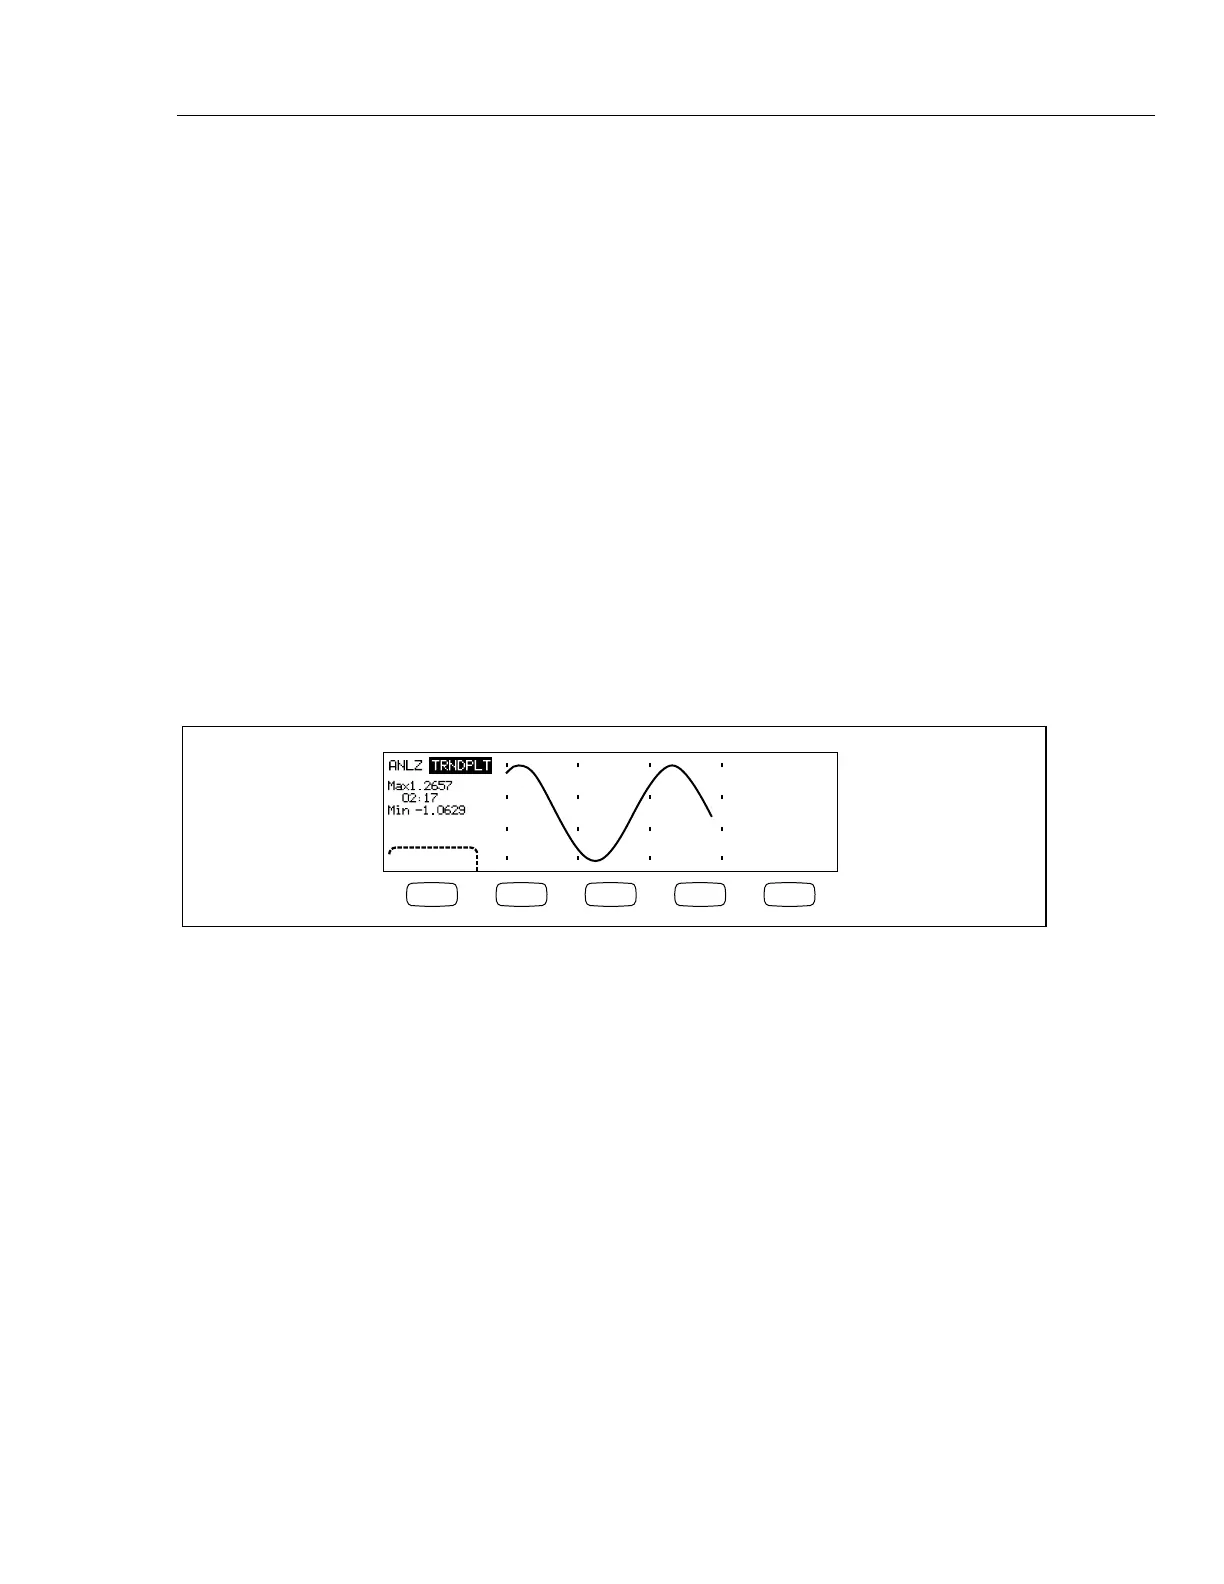
The left section of the Meter’s display indicates the highest (maximum) and lowest
(minimum) reading taken since the start of a TrendPlot session. In addition, the length of
the TrendPlot session is displayed in hours, minutes, and seconds (hh:mm:ss).
To start a TrendPlot session:
1. Set up the Meter for the desired measurement by selecting the function and
connecting the signal to the Meter’s input.
Note
Setting the range function to manual will cause the Trendplot display to
plot at the top or bottom edge of the plot area without making an amplitude
adjustment when the input signal exceeds the limits of the Meter’s range.
2. With the Meter taking measurements, press J.
3. Press the TREND PLOT soft key to start the session.
As shown in Figure 3-1, the display will start plotting the readings across the plot area,
and the maximum, minimum, and elapsed time are displayed. When there are longer
intervals or delays between readings, TrendPlot will initially look like unconnected dots
until enough time elapses to gather more readings.
STOP
F1 F2 F3 F4 F5
caw057.eps
Figure 3-1. TrendPlot Display
 Loading...