SourceMeter® Instrument User's Manual Section 5: Measuring low-
2450-900-01 Rev. E / August 2019 5-7
View the buffer statistics on the front panel
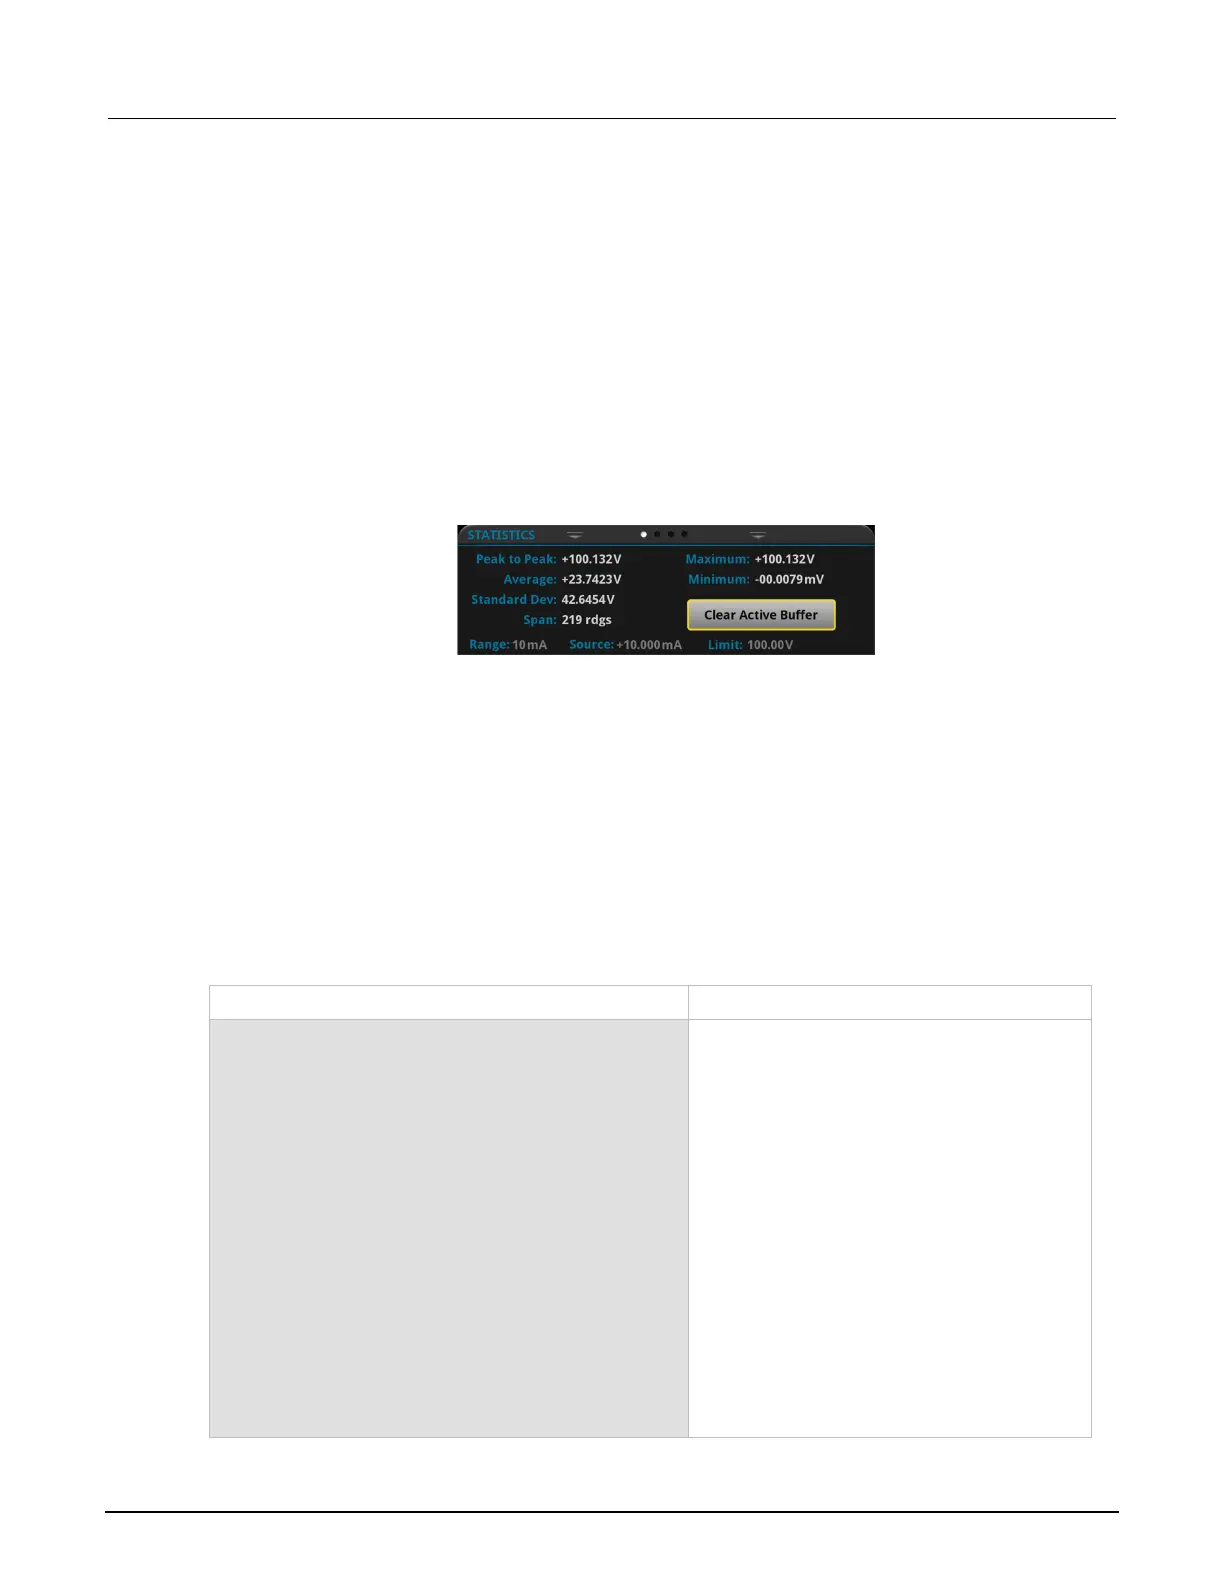
You can view the measurement statistics on the 2450 front-panel STATISTICS swipe screen,
including:
• Peak-to-peak value
• Minimum, maximum, and average reading values
• Standard deviation
To view the statistics, from the home screen, swipe to the STATISTICS screen.
Figure 26: STATISTICS swipe screen
Set up the low-resistance application using SCPI commands
The following sequence of SCPI commands makes 100 low-resistance measurements by sourcing
current and measuring resistance. In this example, the source current magnitude and limit voltage are
set automatically. It uses remote commands to change the front-panel display to show the GRAPH
swipe screen. This allows you to view numeric data at the top of the screen and graphic data at the
bottom of the screen.
You may need to make changes so that this code will run in your programming environment.
Send the following commands for this example application:
Command Description
TRIG:LOAD "SimpleLoop", 100
SENS:FUNC "RES"
SENS:RES:RANG:AUTO ON
SENS:RES:OCOM ON
SENS:RES:RSEN ON
DISP:SCR SWIPE_GRAPh
OUTP ON
INIT
*WAI
OUTP OFF
TRAC:DATA? 1, 100, "defbuffer1", READ, REL
Reset the 2450.
Configure Simple Loop trigger model
template to make 100 readings.
Set to measure resistance.
Turn on auto range.
Enable offset compensation.
Set to use 4-wire sense mode.
Show the GRAPH swipe screen.
Turn on the output.
Initiate readings.
Wait until finished.
Turn off the output.
Read the resistance and time values from
.