6-5
The display screen appears as shown above before the graph is drawn. At this point, you can
change the Start and Width values.
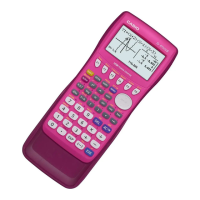
I Med-box Graph
This type of graph lets you see how a large number of
data items are grouped within specific ranges. A box
encloses all the data in an area from the first quartile
(Q1) to the third quartile (Q3), with a line drawn at the
median (Med). Lines (called whiskers) extend from
either end of the box up to the minimum (minX) and
maximum (maxX) of the data.
From the statistical data list, press (GRPH) to display the
graph menu, press (SET), and then change the graph
type of the graph you want to use (GPH1, GPH2, GPH3) to
med-box graph.
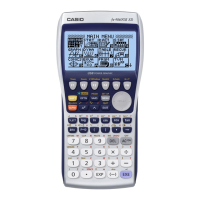
To plot the data that falls outside the box, first specify
“MedBox” as the Graph Type. Then, on the same screen you
use to specify the graph type, turn the Outliers item “On”,
and draw the graph.
• Changing the “Q1Q3 Type” setting on the Setup screen can cause the Q1 and Q3 positions
to change, even when a Med-box graph is drawn based on a single list.
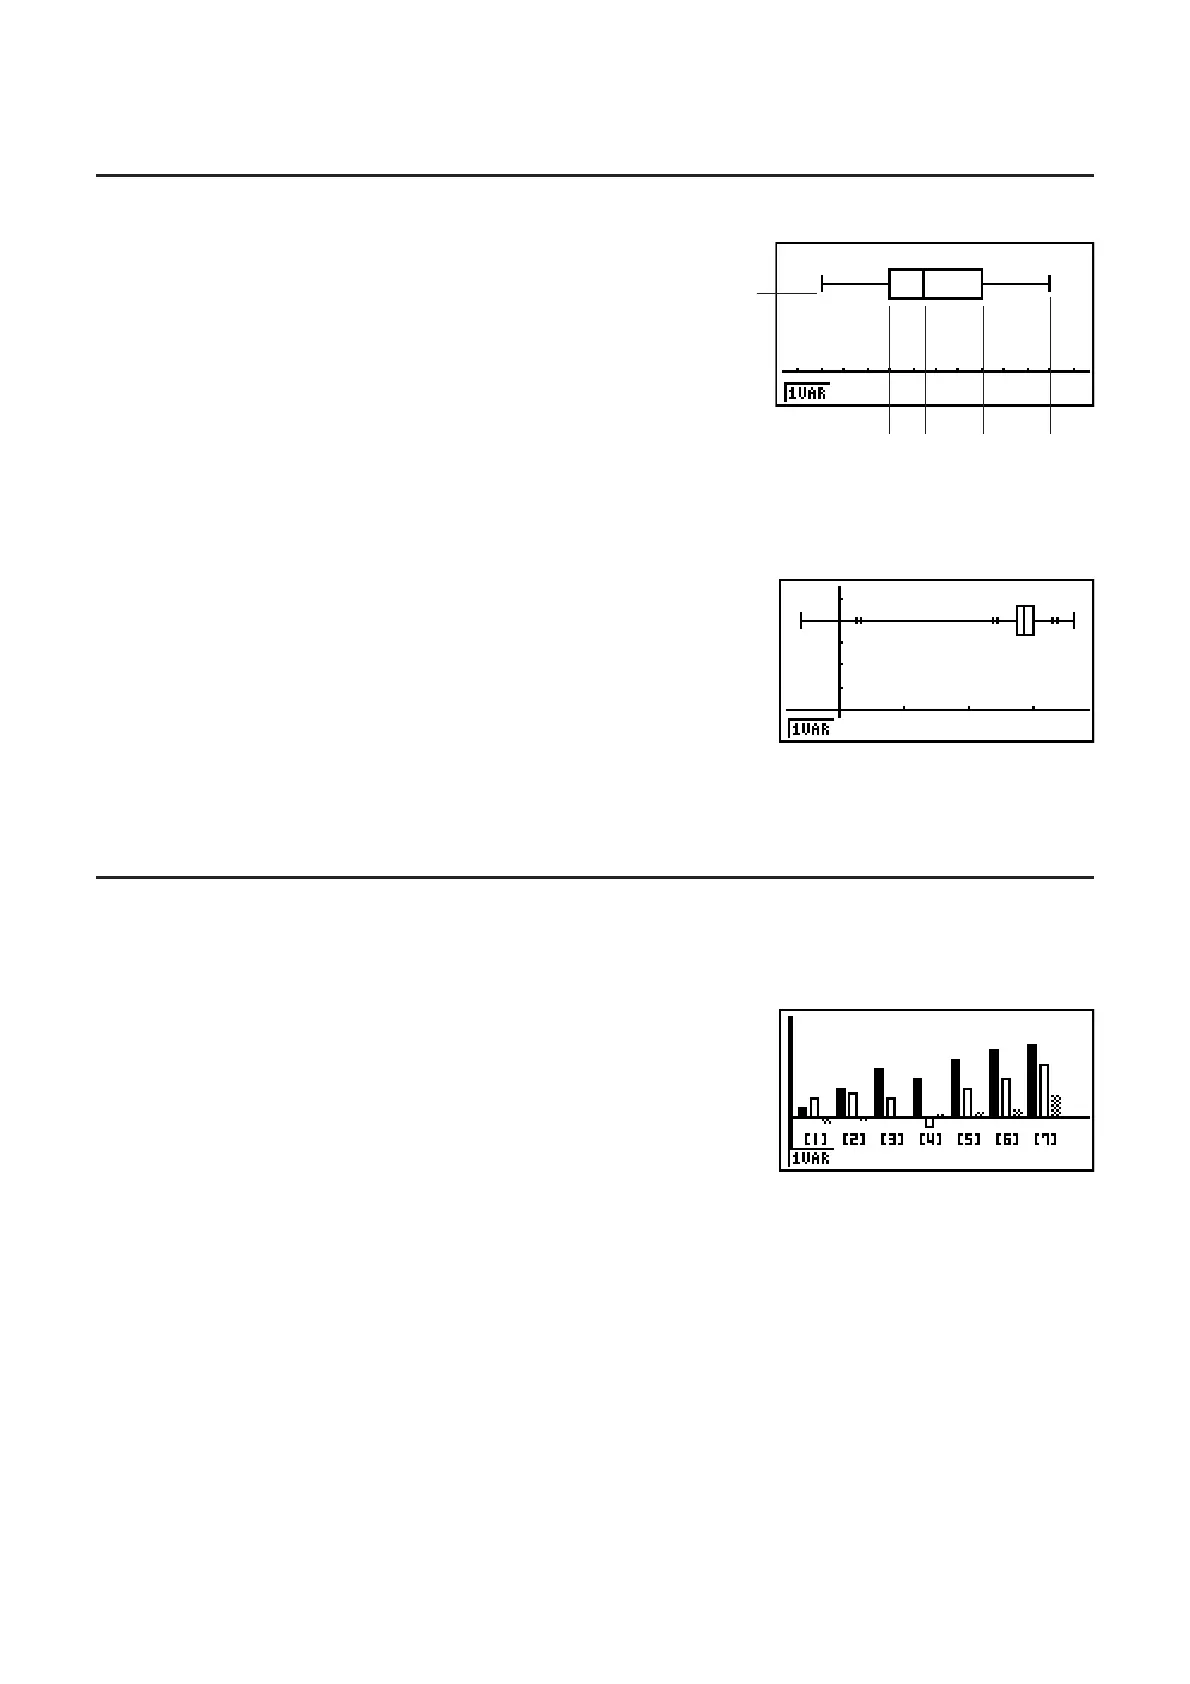
I Bar Graph
You can specify up to three lists for drawing a bar graph. The graph is labeled [1], [2], [3], and
so on, corresponding to lines 1, 2, 3, and so on of the list used for the graph data.
• Any of the following causes an error and cancels bar graph drawing.
- A Condition ERROR occurs when drawing of multiple graphs is specified using the graph
On/Off screen (page 6-3), and bar graph is specified for one of the graphs and a different
graph type is specified for another graph.
- A Dimension ERROR occurs when you draw a graph with two or three lists specified and
the specified lists have a different number of list elements.
- A Condition ERROR occurs when lists are assigned for Data1 and Data3, while “None” is
specified for Data2.
minX
MedQ1 Q3 maxX
minX
MedQ1 Q3 maxX

 Loading...