5-1
Chapter 5 Graphing
Select the icon in the Main Menu that suits the type of graph you want to draw or the type of table
you want to generate.
• Graph … General function graphing
• Run-Matrix … Manual graphing (pages 5-25 to 5-31)
• Table … Number table generation (pages 5-32 to 5-37)
• Dyna Graph … Dynamic graphing (pages 5-42 to 5-45)
• Recursion … Recursion graphing or number table generation (pages 5-45 to 5-50)
• Conic Graphs … Conic section graphing (pages 5-50 and 5-51)
1. Sample Graphs
k Graph Relation List Screen and Graph Color
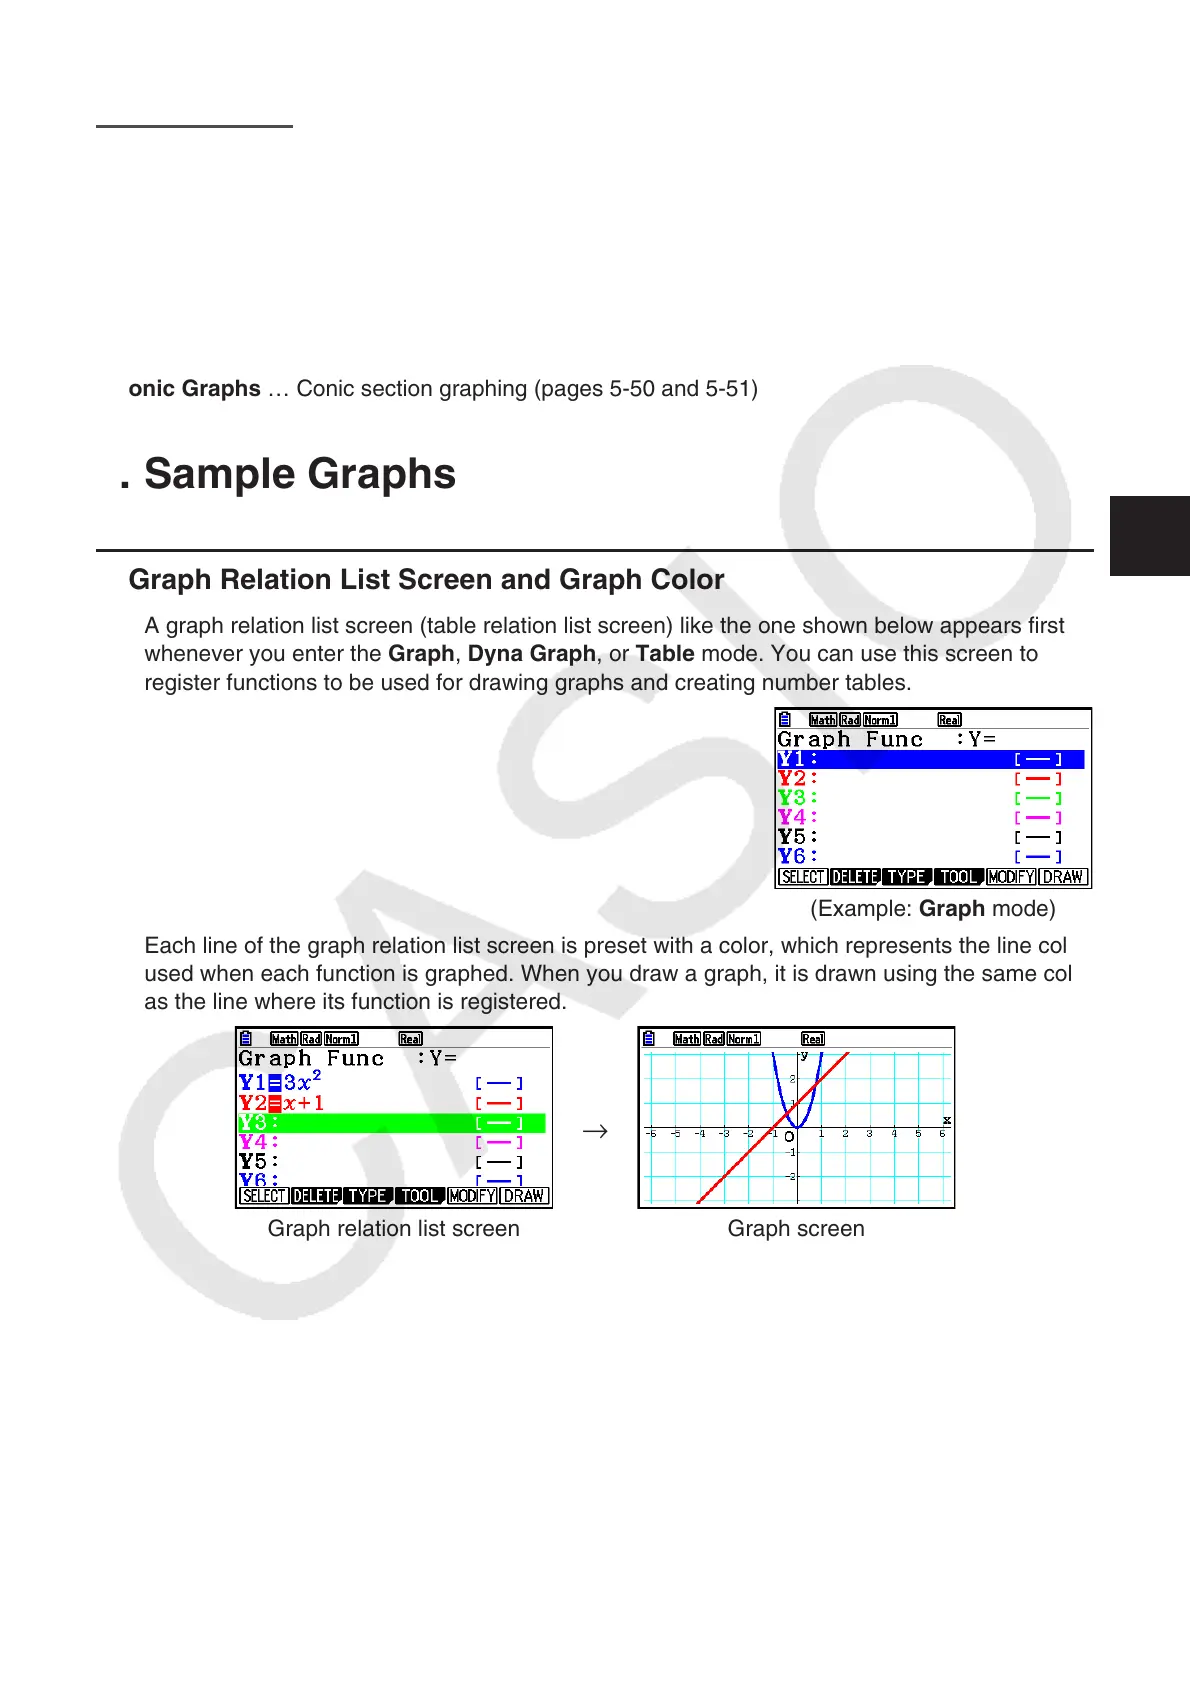
A graph relation list screen (table relation list screen) like the one shown below appears first
whenever you enter the Graph, Dyna Graph, or Table mode. You can use this screen to
register functions to be used for drawing graphs and creating number tables.
(Example: Graph mode)
Each line of the graph relation list screen is preset with a color, which represents the line color
used when each function is graphed. When you draw a graph, it is drawn using the same color
as the line where its function is registered.
Graph relation list screen
→
Graph screen
5

 Loading...


