5-25
6. Manual Graphing
k Graphing in the Run-Matrix Mode
While the Linear input/output mode is selected, commands can be input directly in the Run-
Matrix mode to draw a graph.
You can select a function type for graphing by pressing !4(SKETCH)5(GRAPH) and
then selecting one of the function types shown below.
• {Y=}/{r=}/{Param}/{X=}/{G ·
dx} ... {rectangular coordinate}/{polar coordinate}/{parametric
function}/{X=f(y) rectangular coordinate}/{integration} graphing
• {Y>}/{Y<}/{Y≥}/{Y≤} ... Inequality {Y>
f(x)}/{Y<f(x)}/{Y≥f(x)}/{Y≤f(x)} graphing
• {X>}/{X<}/{X≥}/{X≤} ... Inequality {X>
f(y)}/{X<f(y)}/{X≥f(y)}/{X≤f(y)} graphing
• Graphing with Rectangular Coordinates
1. From the Main Menu, enter the Run-Matrix mode.
2. On the Setup screen, change “Input/Output” setting to “Linear”.
3. Configure V-Window settings.
4. Input the commands for drawing the rectangular coordinate graph.
5. Input the function.
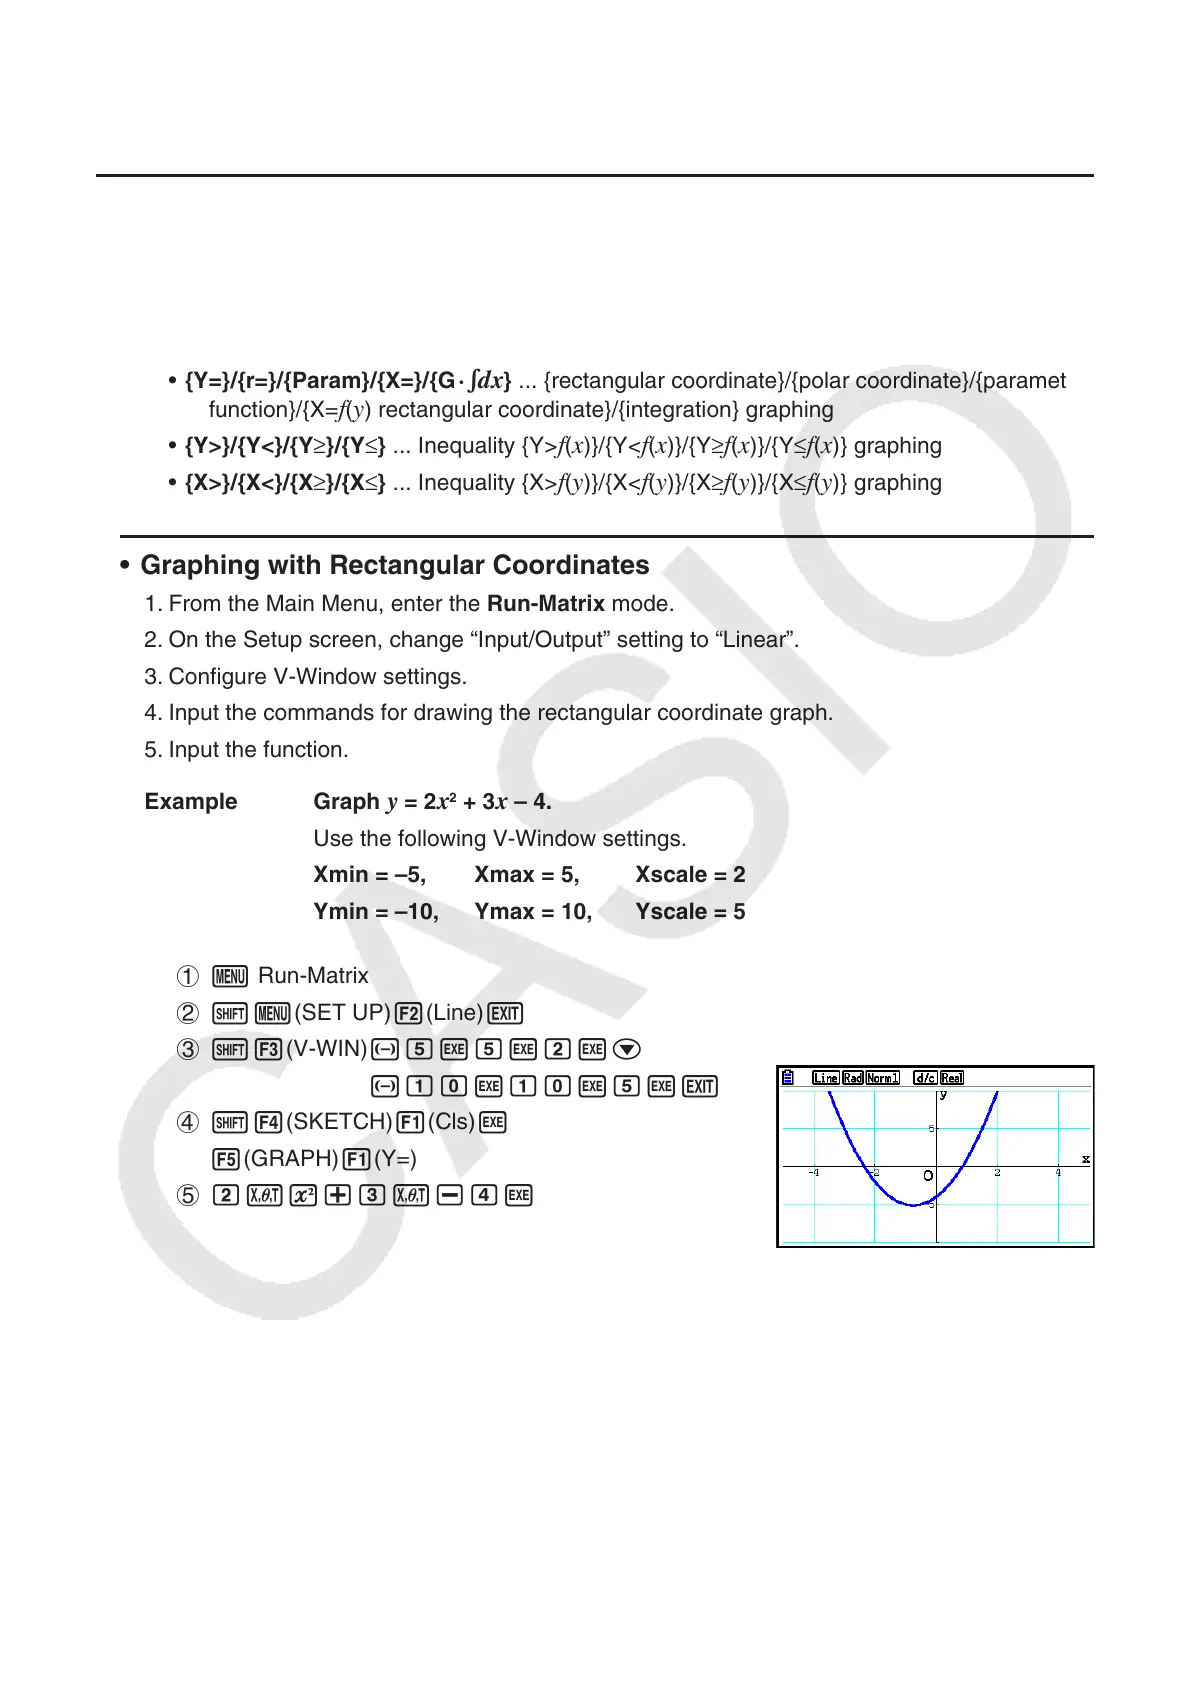
Example Graph
y = 2x
2
+ 3x – 4.
Use the following V-Window settings.
Xmin = –5, Xmax = 5, Xscale = 2
Ymin = –10, Ymax = 10, Yscale = 5
1 m Run-Matrix
2 !m(SET UP)2(Line)J
3 !3(V-WIN) -fwfwcwc
-bawbawfwJ
4 !4(SKETCH)1(Cls)w
5(GRAPH)1(Y=)
5 cvx+dv-ew
 Loading...


