5-5
2. Controlling What Appears on a Graph Screen
k V-Window (View Window) Settings
Use the View Window to specify the range of the x - and y -axes, and to set the spacing
between the increments on each axis. You should always set the V-Window parameters you
want to use before graphing.
u To configure V-Window settings
1. From the Main Menu, enter the Graph mode.
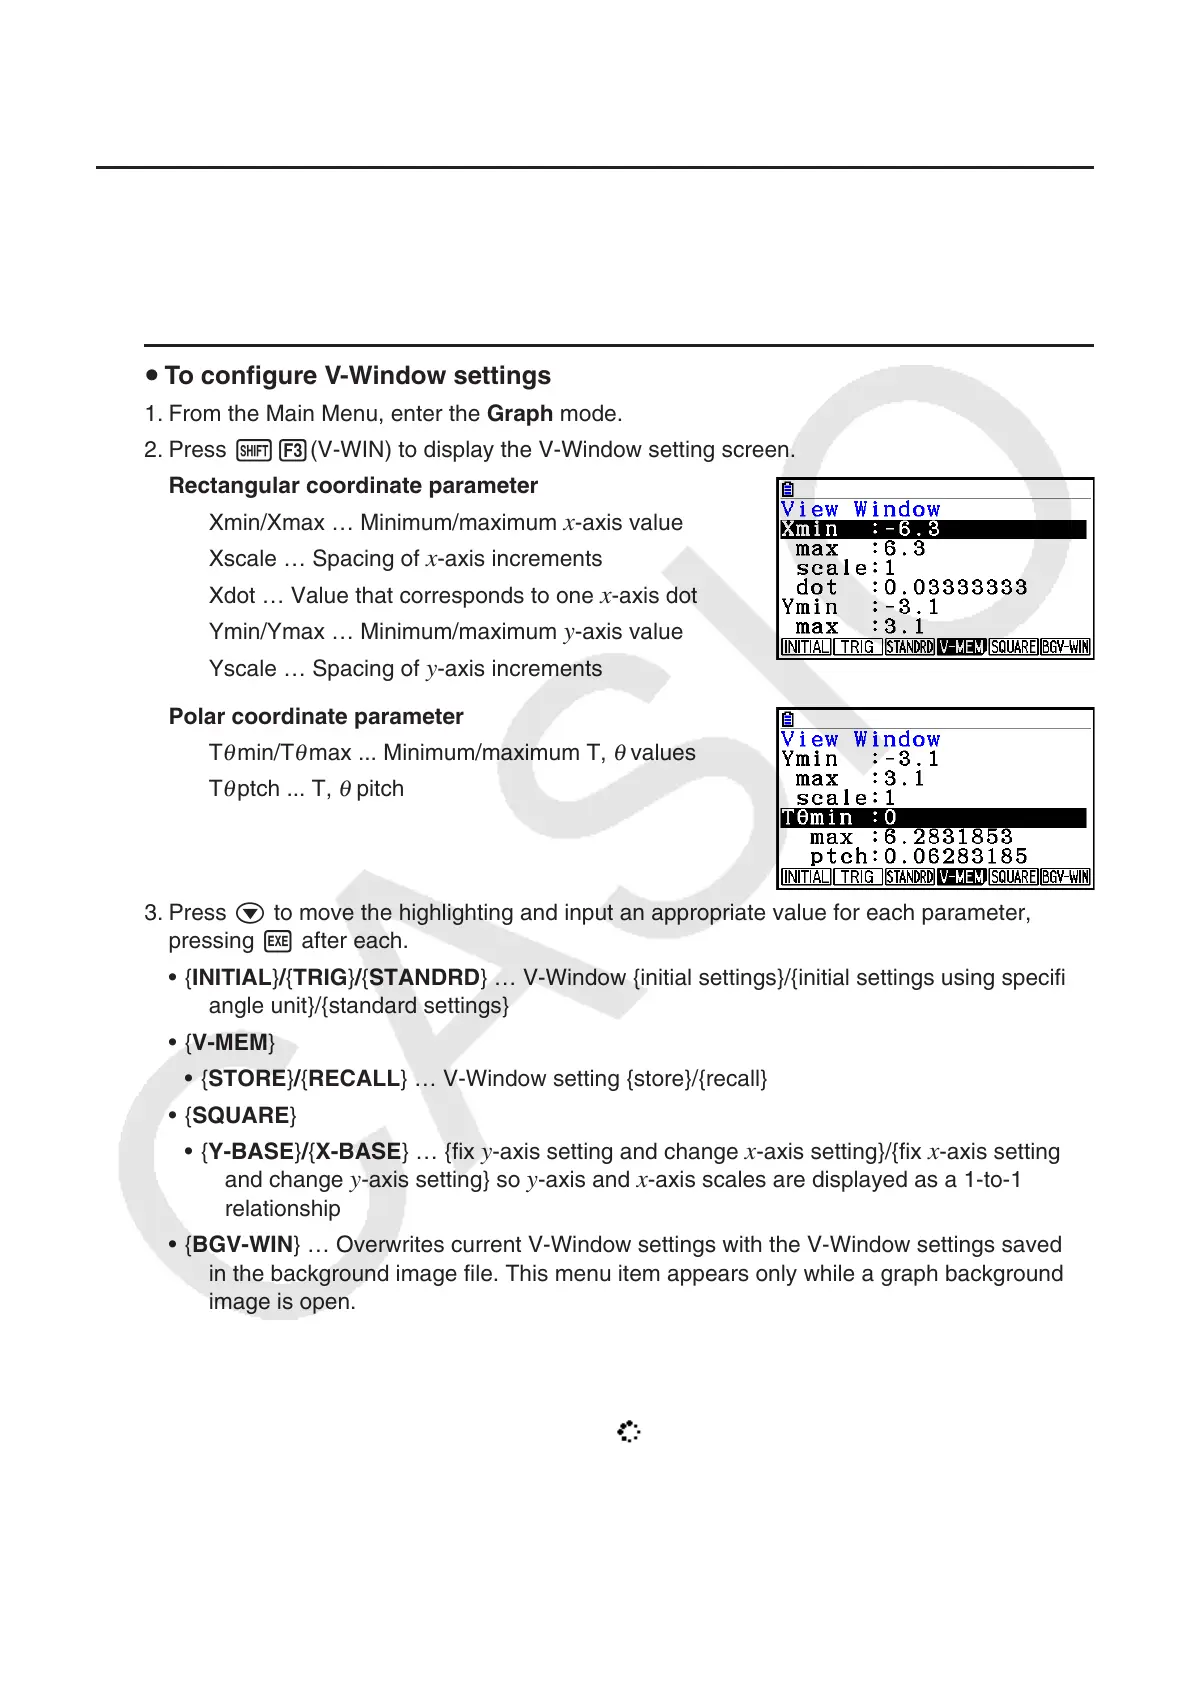
2. Press !3(V-WIN) to display the V-Window setting screen.
Rectangular coordinate parameter
Xmin/Xmax … Minimum/maximum
x-axis value
Xscale … Spacing of
x-axis increments
Xdot … Value that corresponds to one
x-axis dot
Ymin/Ymax … Minimum/maximum
y-axis value
Yscale … Spacing of
y-axis increments
Polar coordinate parameter
T
θ
min/T
θ
max ... Minimum/maximum T,
θ
values
T
θ
ptch ... T,
θ
pitch
3. Press c to move the highlighting and input an appropriate value for each parameter,
pressing w after each.
• {INITIAL}/{TRIG}/{STANDRD} … V-Window {initial settings}/{initial settings using specified
angle unit}/{standard settings}
• {V-MEM}
• {STORE}/{RECALL} … V-Window setting {store}/{recall}
• {SQUARE}
• {Y-BASE}/{X-BASE} … {fix
y-axis setting and change x-axis setting}/{fix x-axis setting
and change y-axis setting} so y-axis and x-axis scales are displayed as a 1-to-1
relationship
• {BGV-WIN} … Overwrites current V-Window settings with the V-Window settings saved
in the background image file. This menu item appears only while a graph background
image is open.
4. After settings are the way you want them, press J or !J(QUIT) to exit the V-
Window setting screen.
• Pressing w without inputting anything while
is on the display exits the V-Window setting
screen.

 Loading...