16-2
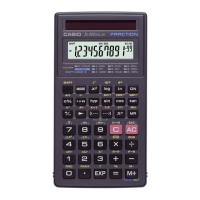
Label (show/hide graph axis labels)
{On}/{Off} ... {show 3D graph screen axis names}/{hide 3D graph screen axis names}
While a 3D graph is on the screen, you can change Label settings by pressing the ,
key.
On Off
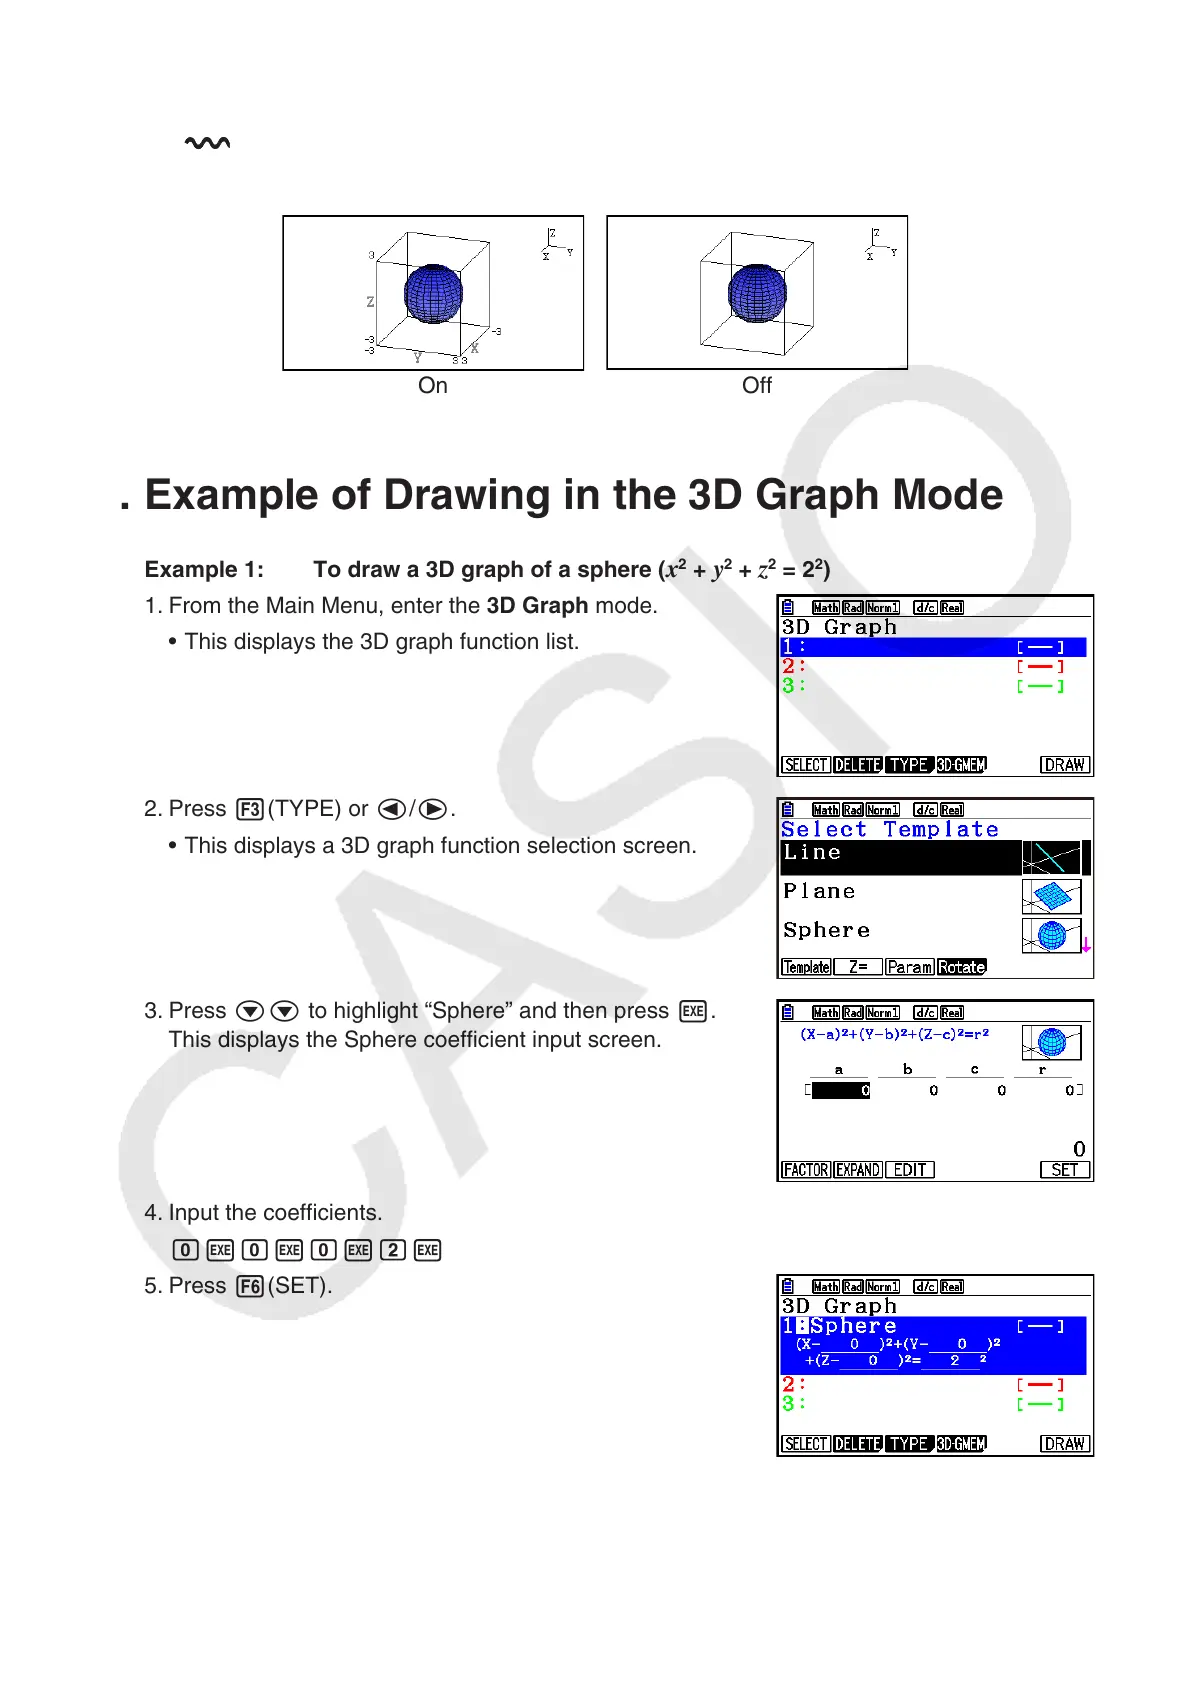
1. Example of Drawing in the 3D Graph Mode
Example 1: To draw a 3D graph of a sphere (x
2
+ y
2
+ z
2
= 2
2
)
1. From the Main Menu, enter the 3D Graph mode.
This displays the 3D graph function list. •
2. Press 3(TYPE) or d/e.
This displays a 3D graph function selection screen. •
3. Press cc to highlight “Sphere” and then press w.
This displays the Sphere coefficient input screen.
4. Input the coefficients.
awawawcw
5. Press 6(SET).
This returns to the 3D graph function list. The list
will show the selected template name and the input
coefficients.
•
u
•

 Loading...