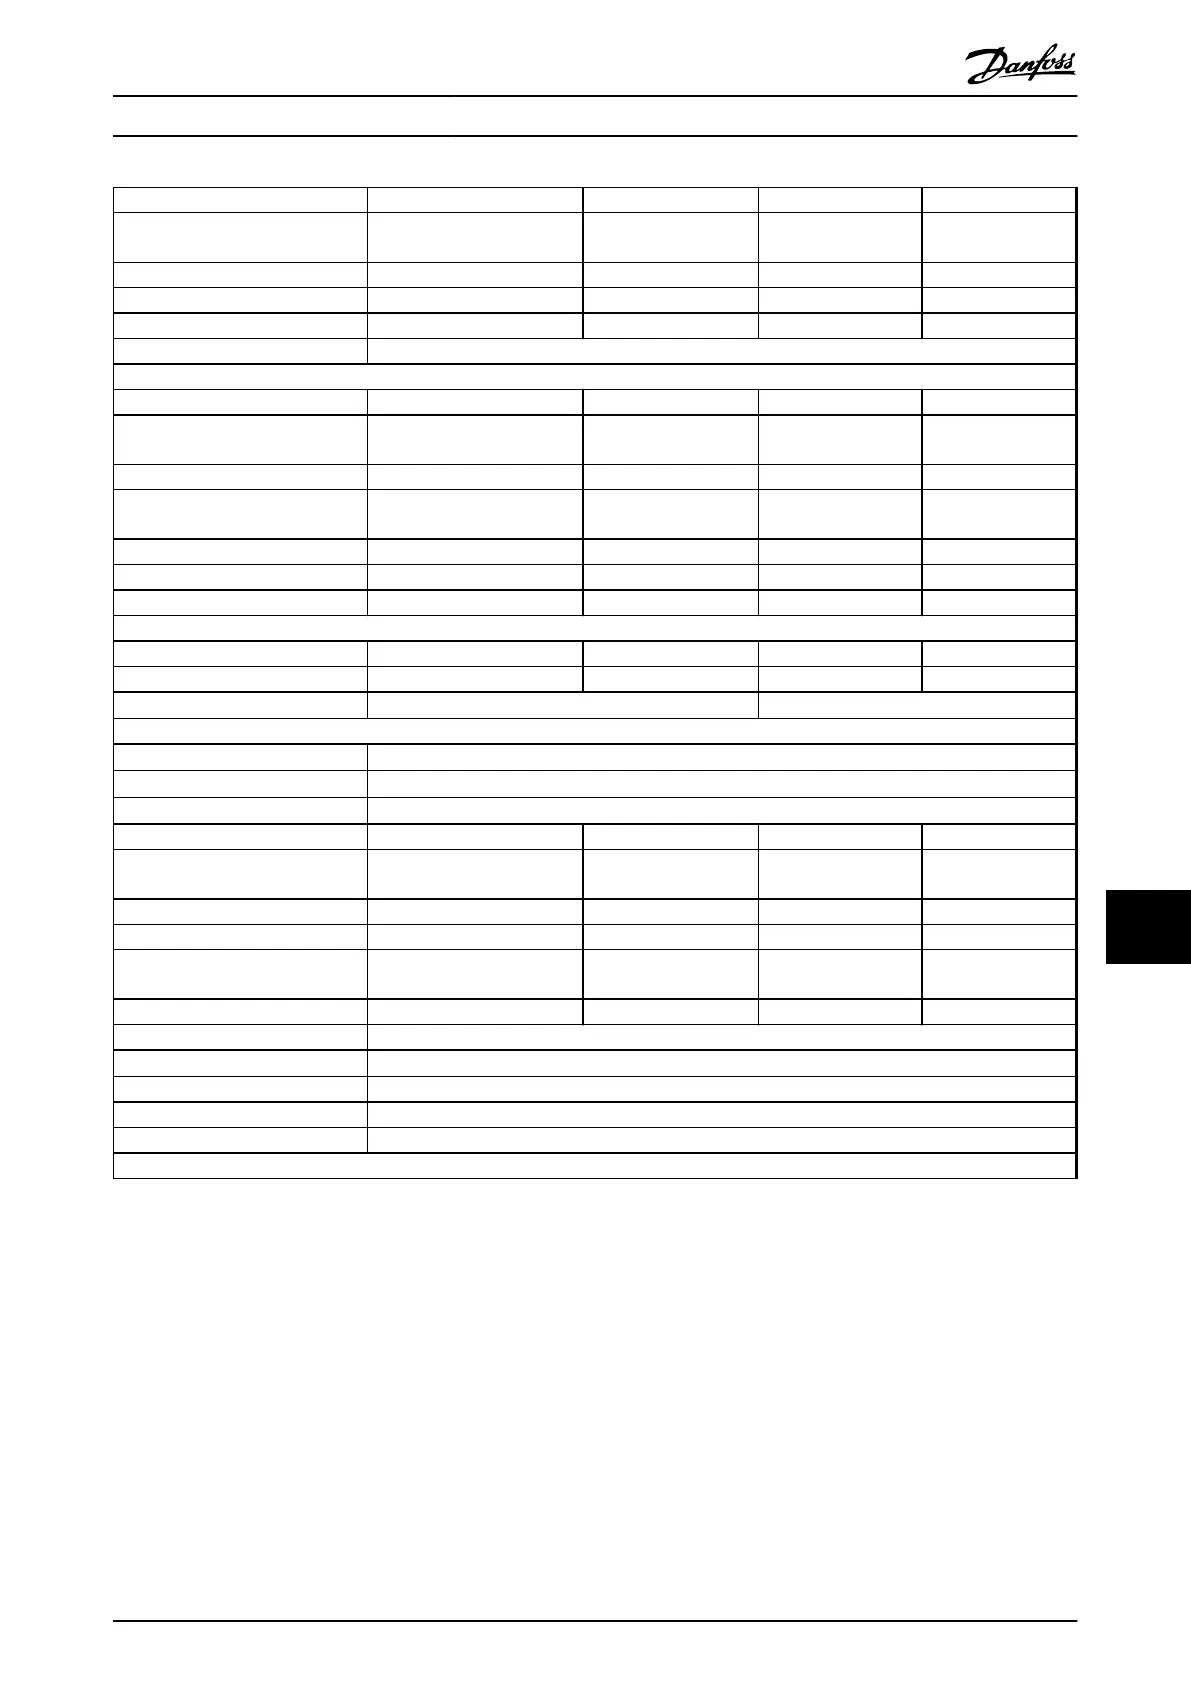
P500 P560 P630 P710
Normal Overload =110% current
for 60 s
NO NO NO NO
Typical shaft output at 400 V [kW] 500 560 630 710
Typical shaft output at 460 V [hp] 650 750 900 1000
Typical shaft output at 480 V [kW] 560 630 710 800
Enclosure IP21/54 F18
Output current
Continuous (at 400 V) [A] 880 990 1120 1260
Intermittent (60 s overload) (at 400
V) [A]
968 1089 1232 1386
Continuous (at 460/480 V) [A] 780 890 1050 1160
Intermittent (60 s overload) (at
460/480 V) [A]
858 979 1155 1276
Continuous kVA (at 400 V) [kVA] 610 686 776 873
Continuous kVA (at 460 V) [kVA] 621 709 837 924
Continuous kVA (at 480 V) [kVA] 675 771 909 1005
Max. Input current
Continuous (at 400 V) [A] 857 964 1090 1227
Continuous (at 460/480 V) [A] 759 867 1022 1129
Max. pre-fuses
1)
[A]
1600
2000
Max. cable size
Motor (mm
2
/AWG
2)
)
8 x 150 (8 x 300 mcm)
Mains (mm
2
/AWG
2)
)
8 x 240 (8 x 500 mcm)
Brake (mm
2
/AWG
2)
)
4 x 185 (4 x 350 mcm)
Total LHD loss 400 V AC [kW] 21909 24592 26640 30519
Total back channel loss 400 V AC
[kW]
17767 19984 21728 24936
Total filter loss 400 V AC [kW] 11747 12771 14128 15845
Total LHD loss 460 V AC [kW] 19896 22353 25030 27989
Total back channel loss 460 V AC
[kW]
16131 18175 20428 22897
Total filter loss 460 V AC [kW] 11020 11929 13435 14776
Weight, enclosure IP21, IP54 [kg] 2009
Efficiency
4)
0.96
Output frequency [Hz] 0-600
Heatsink overtemp. trip [°C] 105
Power card ambient trip [°C] 85
*Normal overload = 110% torque during 60 s
Table 11.3 Mains Supply 3x380-480 V AC
1) For type of fuse, see chapter 11.5.1 Fuses.
2) American wire gauge.
3) Measured using 5 m screened motor cables at rated load and rated frequency.
4) The typical power loss is at nominal load conditions and expected to be within ±15% (tolerence relates to
variety in voltage and cable conditions). Values are based on a typical motor efficiency (IE2/IE3 border line). Motors
with lower efficiency also add to the power loss in the frequency converter and opposite. If the switching
frequency is increased to the default setting, the power losses may rise significantly. LCP and typical control card
power consumptions are included. Further options and customer load may add up to 30 W to the losses. (Though
typical only 4 W extra for a fully loaded control card, or options for slot A or slot B, each).
Although measurements are made with state-of-the-art equipment, some measurement inaccuracy must be
allowed for (±5%).
Specifications
Operating Instructions
MG37A202 Danfoss A/S © Rev. 2014-07-29 All rights reserved. 141
11 11
 Loading...