Network Video Recorder User Manual
159
13.5 Heat Map
Purpose:
Heat map is a graphical representation of data. The heat map function is usually used to analyze
how many people visited and stayed in a specified area.
The heat map function must be supported by the connected IP camera and the corresponding
configuration must be set.
Step 1 Go to Smart Analysis > Heat Map.
Step 2 Select a camera.
Step 3 Select the report type as Daily Report, Weekly Report, Monthly Report, or Annual Report.
Step 4 Set the Data to analyze.
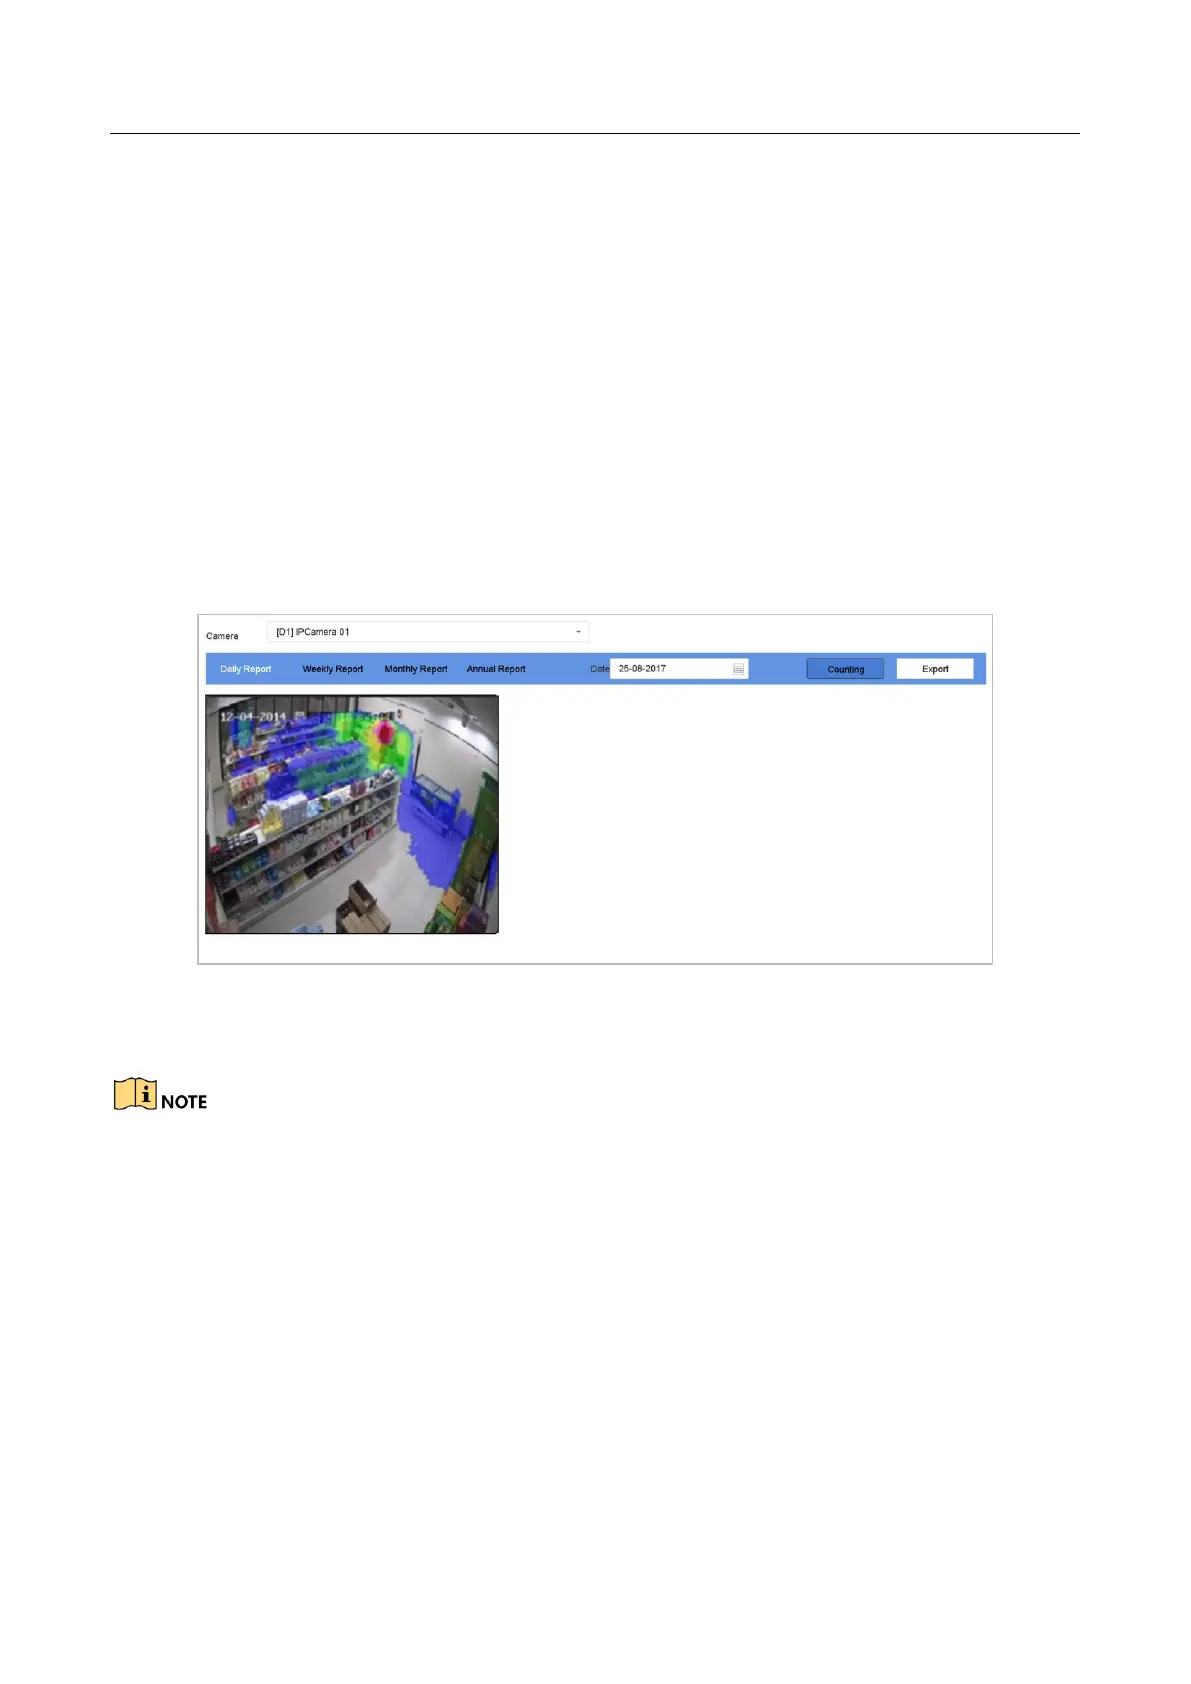
Figure 13-5 Heat Map Interface
Step 5 Click Counting. Then the results displayed in graphics marked in different colors will show.
As shown in the figure above, red color block (255, 0, 0) indicates the most visited area, and blue
color block (0, 0, 255) indicates the less-popular area.
Step 6 (Optional) Click Export to export the statistics report in excel format.
 Loading...