D–1
D
Appendix D: Parameter
Measurement
Parameters and How They Work
In this Appendix, a general explanation of how the
instrument’s standard parameters are computed (see below) is
followed by a table listing, defining and describing those
parameters (page D–5).
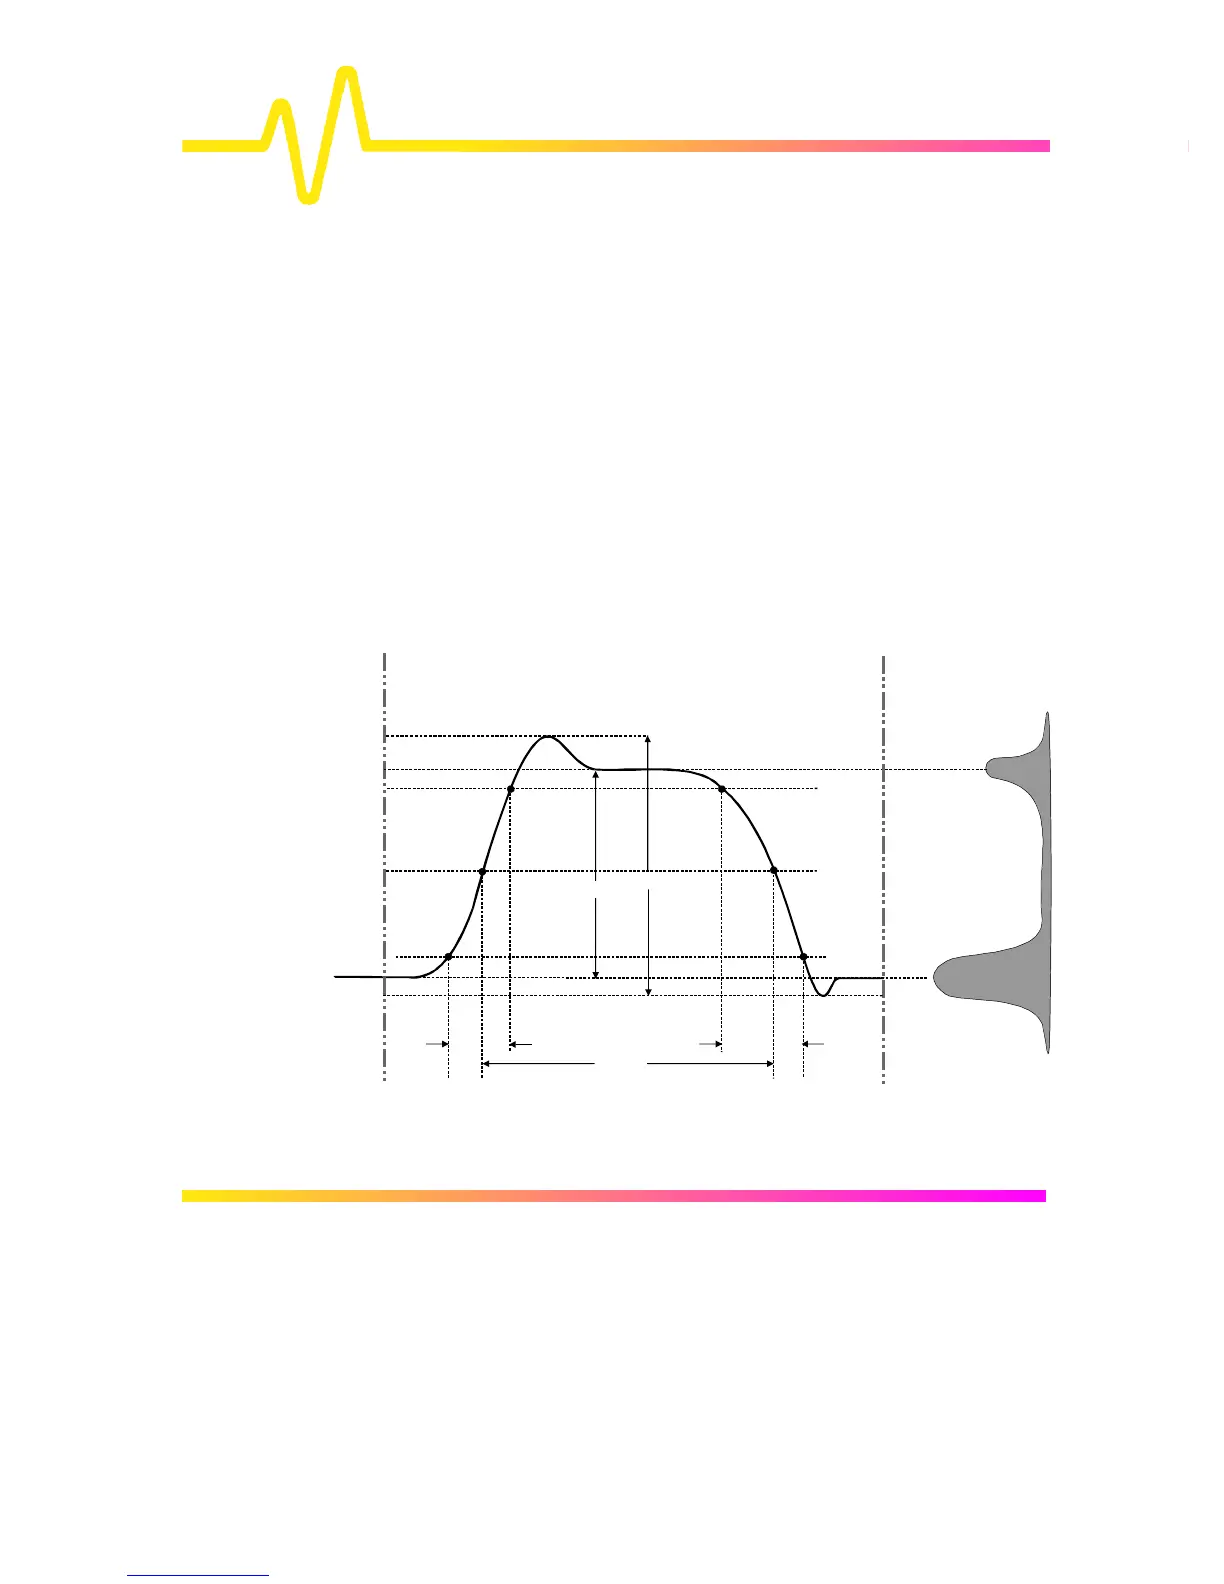
Proper determination of the top and base reference lines is
fundamental for ensuring correct parameter calculations. The
analysis begins by computing a histogram of the waveform data
over the time interval spanned by the left and right time cursors. For
example, the histogram of a waveform transitioning in two states will
contain two peaks (Fig. D–1). The analysis will attempt to identify
the two clusters that contain the largest data density. Then the most
probable state (centroids) associated with these two clusters will be
computed to determine the top and base reference levels: the top
line corresponds to the top and the base line to the bottom centroid.
Figure D–1
Determining Top and
Base Lines
rise
fall
ampl
pkpk
maximum
top
HISTOGRAM*
minimum
base
*not to scale
Lower Threshold
 Loading...