Previews 123
5. Solve for the unknown variable.
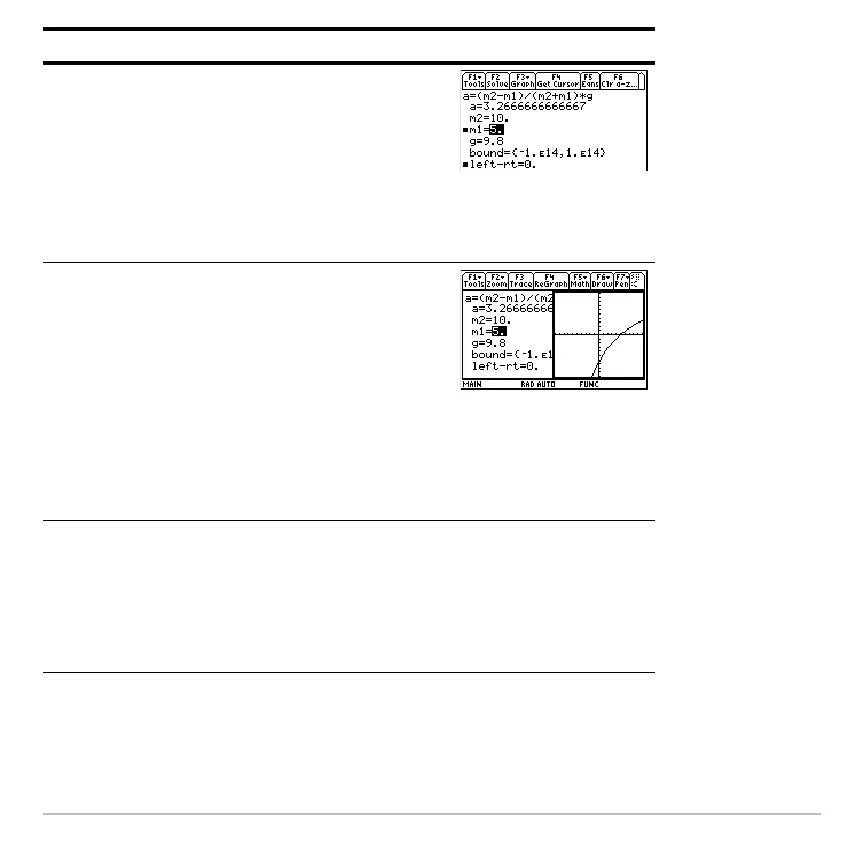
To check the solution’s accuracy, the left
and right sides of the equation are
evaluated separately. The difference is
shown as left-rt. If the solution is precise,
left-rt=0.
Press „
0
marks the calculated
values.
6. Graph the solution using a ZoomStd
viewing window.
The graph is displayed in a split screen.
You can explore the graph by tracing,
zooming, etc.
The variable marked by the cursor
(unknown variable m1) is on the x axis,
and left-rt is on the y axis.
Press … 3
7. Return to the
Numeric Solver and exit the
split screen.
You can press ¸ or D to redisplay the
list of variables.
Press 2 a … 2
Steps and keystrokes Display

 Loading...


