Differential Equation Graphing 421
Note: t is not valid for either Axis when Fields=DIRFLD. If you select t, an Invalid axes
error occurs when graphing.
Example of Time and Custom Axes
Using the predator-prey model from biology, determine the numbers of rabbits and foxes
that maintain population equilibrium in a certain region. Graph the solution using both
time and custom axes.
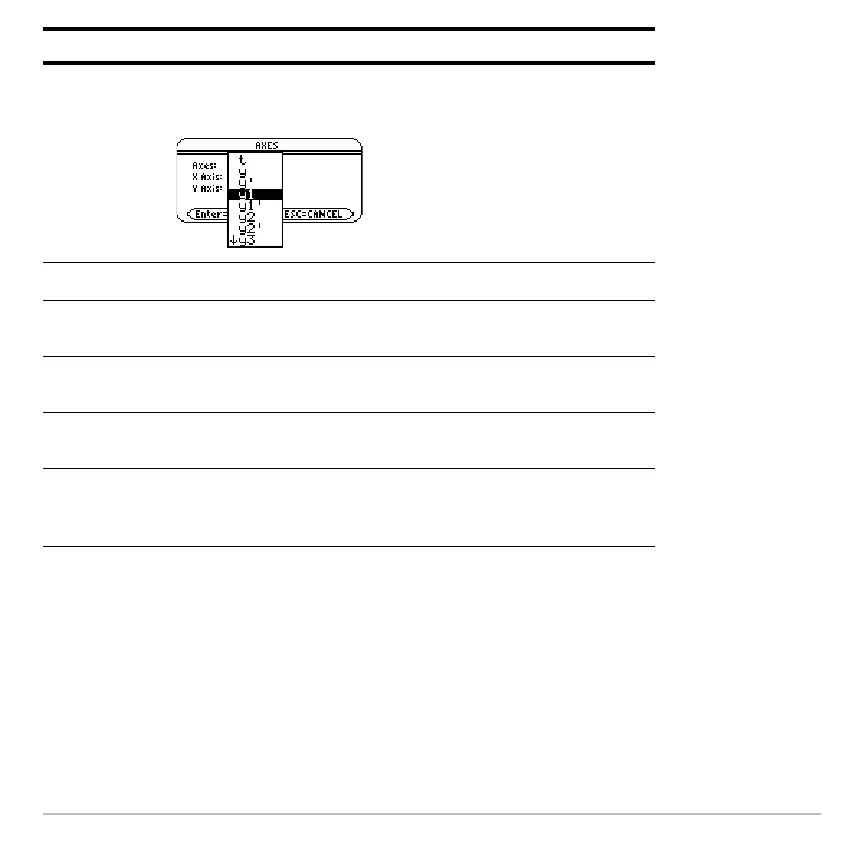
XAxis, YAxis Active only when Axes = CUSTOM, these let you select
what you want to plot on the x and y axes.
t — time
y — solutions (y1, y2, etc.) of all selected differential
equations
y' — values of all selected differential equations (y1', y2',
etc.)
y1, y2, etc. — the solution to the corresponding differential
equation, regardless of whether that equation is selected
y1', y2', etc. — the value of the right-hand side of the
corresponding differential equation, regardless of whether
that equation is selected
Item Description

 Loading...


