Statistics and Data Plots 536
• 1st quartile is the median of points between minX and medStat, and 3rd quartile is
the median of points between
medStat and maxX.
Defining a Statistical Plot
From the Data/Matrix Editor, you can use the entered data to define several types of
statistical plots. You can define up to nine plots at a time.
Procedure
From the
Data/Matrix Editor:
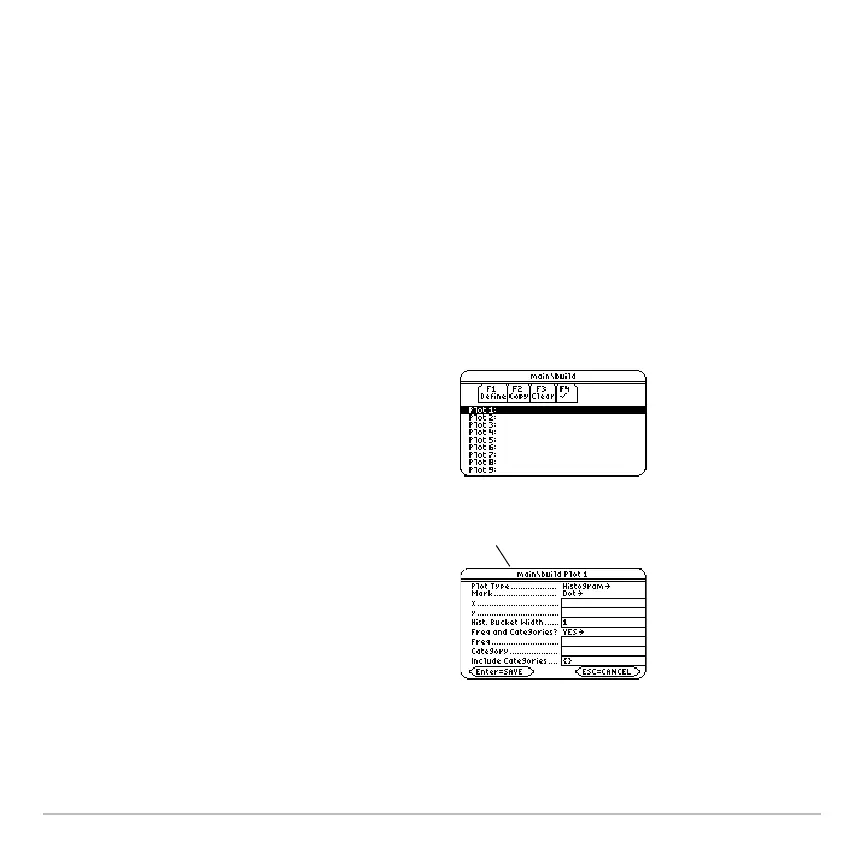
1. Press „ to display the
Plot Setup screen.
Initially, none of the plots are defined.
2. Move the cursor to highlight the plot
number that you want to define.
3. Press ,
to define the plot.
This example shows all items as active.
On your calculator, items are active only if
they are valid for the current setting of
Plot Type and use Freq and Categories?.
Note: If an item is not valid for the current
settings, it will appear dimmed. You
cannot move the cursor to a dimmed item.
Pathname of the data
variable

 Loading...


