Differential Equation Graphing 425
Example Comparison of RK and Euler
Consider a logistic growth model dP/dt = .001ùPù(100NP), with the initial condition P(0) =
10
. Use the BldData instruction to compare the graphing points calculated by the RK and
Euler solution methods. Then plot those points along with a graph of the equation’s exact
solution.
Example
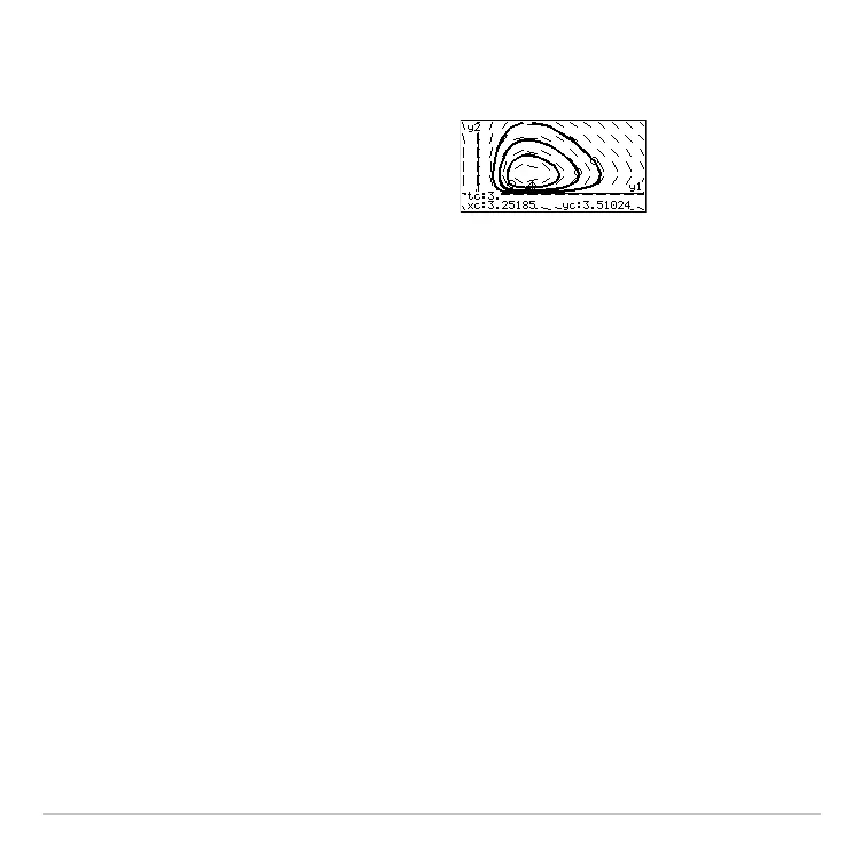
13. Return to the Graph screen, which
displays a curve for each pair of initial
conditions.
14. Press … to trace. Then press
3 ¸ to
see the number of foxes (
xc) and rabbits
(
yc) at t=3.
Because
t0=0 and tmax=10, you can trace
in the range 0 t 10.
Note: Use C and D to move the trace
cursor from one initial condition curve to
another.
1. Press 3 and set
Graph=DIFF
EQUATIONS
.

 Loading...


