Sequence Graphing 356
6. On the Window Editor (8$), set the Window variables.
8. Press …. Then use B to trace the web.
As you trace to larger values of nc, notice that xc and yc oscillate between 2.05218
and 3.19782.
Using Custom Plots
CUSTOM axes give you great flexibility in graphing sequences. As shown in the
following example, CUSTOM axes are particularly effective for showing relationships
between one sequence and another.
nmin=1
nmax=100
plotstrt=1
plotstep=1
xmin=2.68
xmax=6.47
xscl=1
ymin=4.7
ymax=47
yscl=1
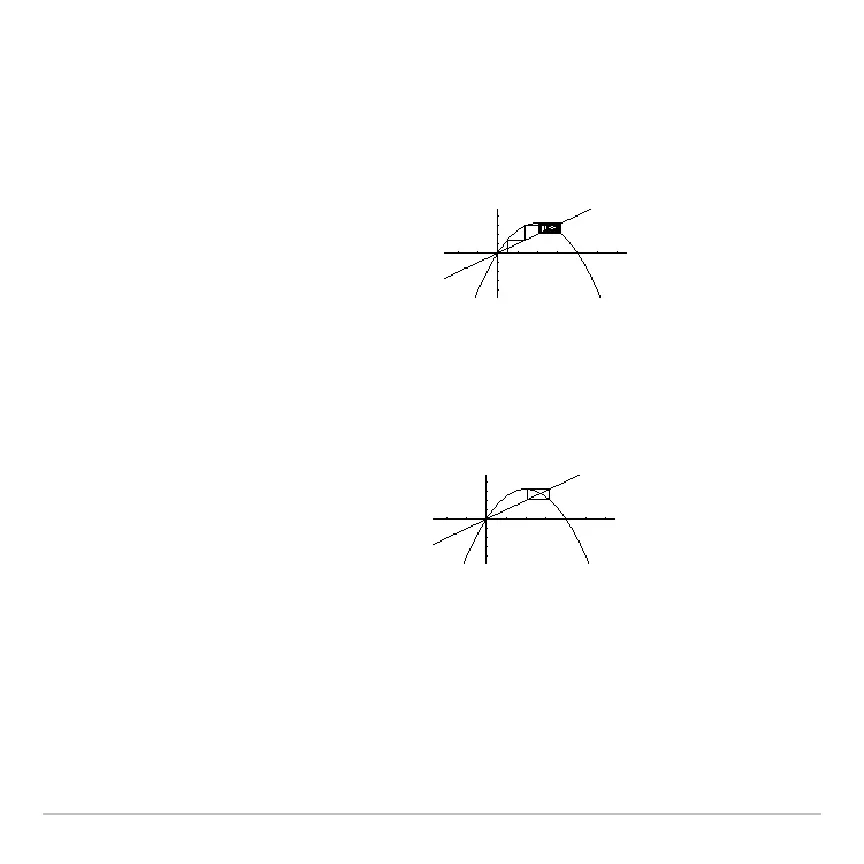
7. Regraph the sequence.
Note: The web moves to an orbit
oscillating between two stable points.
9. On the Window Editor, set
plotstrt=50.
Then regraph the sequence.
Note: By starting the web plot at a later
term, the stable oscillation orbit is
shown more clearly.
y=3.2xN.8x
u(nN1)
u(n)
y=x

 Loading...


