EasyManuals Logo
Home>Texas Instruments>Calculator>TI-89 Titanium

Texas Instruments TI-89 Titanium User Manual

Texas Instruments TI-89 Titanium
977 pages
To Next Page IconTo Next Page
To Previous Page IconTo Previous Page
Page #330 background imageLoading...
Page #330 background image
Polar Graphing 327
Exploring the Graph
From the Graph screen, you can:
Display the coordinates of any pixel by using the free-moving cursor, or of a plotted
point by tracing a polar equation.
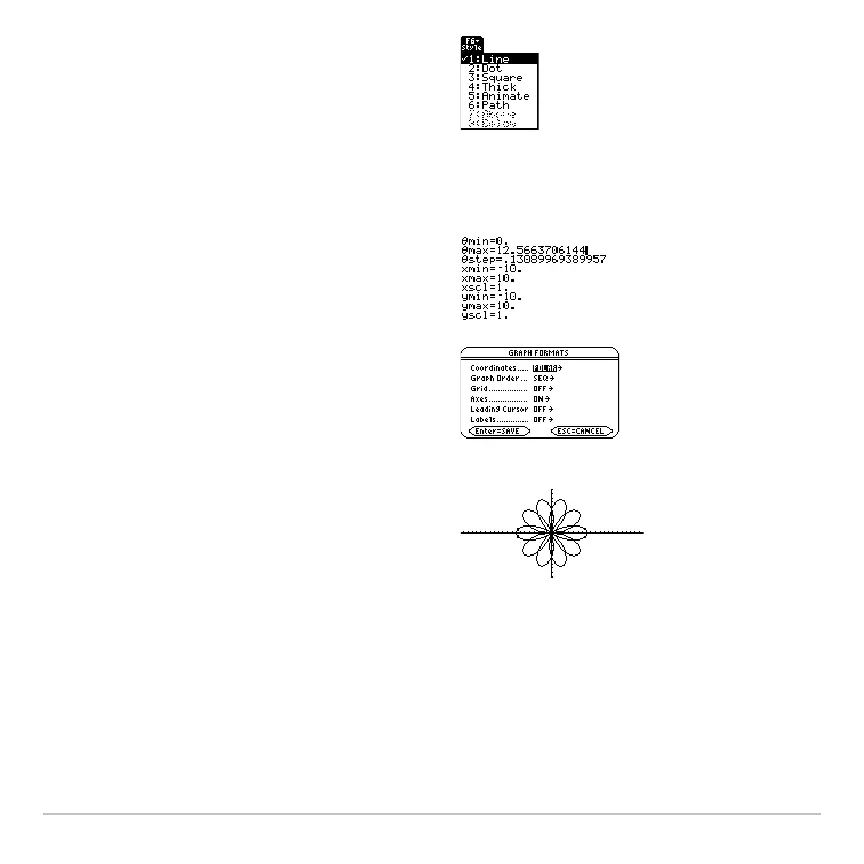
4. Set the display style for an equation. You
can set either the x or y component.
2 ˆ
This is optional. For multiple equations,
this helps visually distinguish one from
another.
5. Define the viewing window (8$).
Zoom also changes the viewing
window.
6. Change the graph format if necessary.
ƒ
9
– or –
8 Í
7. Graph the selected equations
(8%).

Table of Contents

Other manuals for Texas Instruments TI-89 Titanium

Questions and Answers:

Question and Answer IconNeed help?

Do you have a question about the Texas Instruments TI-89 Titanium and is the answer not in the manual?

Texas Instruments TI-89 Titanium Specifications

General IconGeneral
BrandTexas Instruments
ModelTI-89 Titanium
CategoryCalculator
LanguageEnglish

Related product manuals