EasyManuals Logo
Home>Texas Instruments>Calculator>TI-89 Titanium

Texas Instruments TI-89 Titanium User Manual

Texas Instruments TI-89 Titanium
977 pages
To Next Page IconTo Next Page
To Previous Page IconTo Previous Page
Page #361 background imageLoading...
Page #361 background image
Sequence Graphing 358
3. On the Window Editor (8$), set the Window variables.
5. On the Y= Editor, set
Axes = CUSTOM, XAxis=u1, and YAxis=u2.
6. On the Window Editor (8$), set the Window variables.
nmin=0
nmax=400
plotstrt=1
plotstep=1
xmin=0
xmax=400
xscl=100
ymin=0
ymax=300
yscl=100
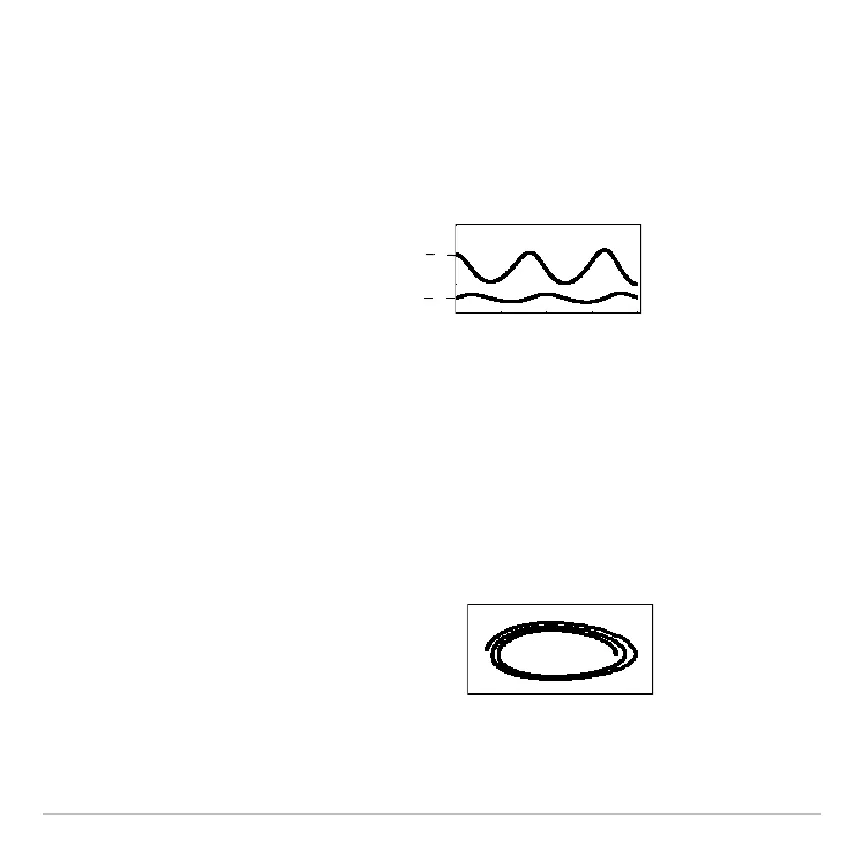
4. Graph the sequence
(8%).
Note: Use to individually
trace the number of rabbits
u1(n) and foxes u2(n) over time
(n).
nmin=0
nmax=400
plotstrt=1
plotstep=1
xmin=84
xmax=237
xscl=50
ymin=25
ymax=75
yscl=10
7. Regraph the sequence.
Note: Use to trace both the number of
rabbits (xc) and foxes (yc) over the cycle
of 400 generations.
u(n)
u1(n)
u2(n)
u2(n)
u1(n)

Table of Contents

Other manuals for Texas Instruments TI-89 Titanium

Questions and Answers:

Question and Answer IconNeed help?

Do you have a question about the Texas Instruments TI-89 Titanium and is the answer not in the manual?

Texas Instruments TI-89 Titanium Specifications

General IconGeneral
BrandTexas Instruments
ModelTI-89 Titanium
CategoryCalculator
LanguageEnglish

Related product manuals