3D Graphing 371
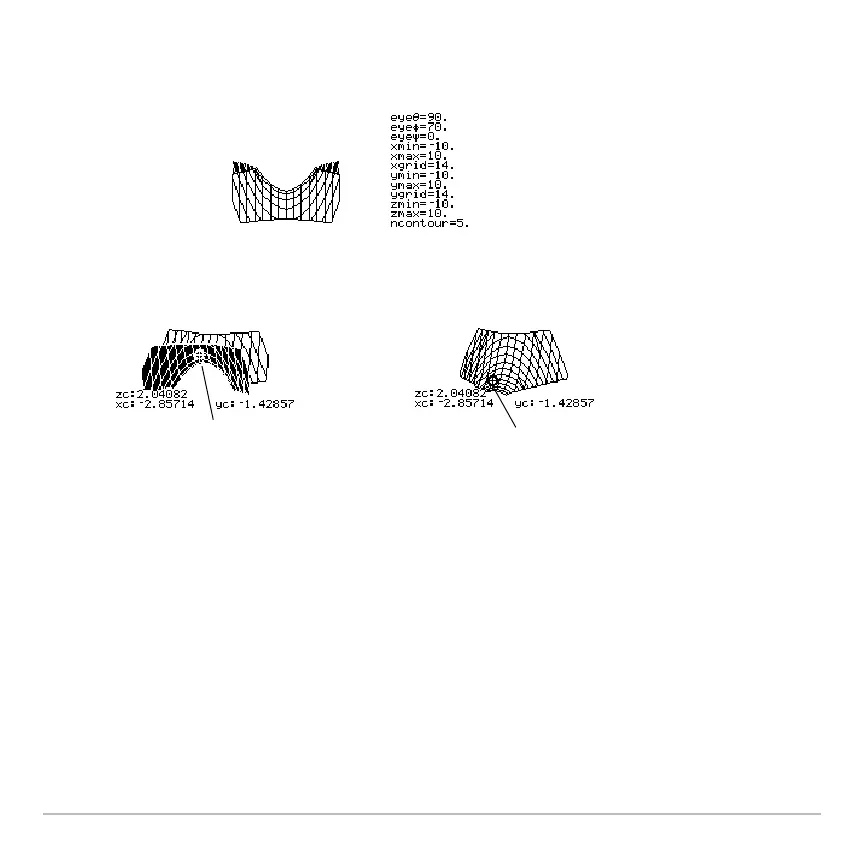
For example, consider a saddle shape z1(x,y) = (x
2
Ny
2
) / 3. The following graph shows
the view looking down the y axis.
Now look at the same shape at 10¡ from the x axis (eyeq = 10).
Note: To cut away the front of the saddle in this example, set xmax=0 to show only
negative x values.
Example of an “Off the Curve” Cursor
Although the cursor can move only along a grid wire, you will see many cases where the
cursor does not appear to be on the 3D surface at all. This occurs when the z axis is too
short to show
z(x,y) for the corresponding x and y values.
You can move the cursor so
that it does not appear to be
on a grid point.
If you cut away the front side,
you can see the cursor is
actually on a grid point on the
hidden back side.
 Loading...


