Statistics and Data Plots 538
• Plots defined with column numbers always use the last data variable in the
Data/Matrix Editor, even if that variable was not used to create the definition.
• To use an existing list variable for x, y, Freq, or Category, type the list name instead
of the column number.
• An example using Freq, Category, and Include Categories is available.
5. Press ¸ (after typing in an input box, press ¸ twice).
Note: Any undefined data points (shown as undef) are ignored in a stat plot.
Selecting or Deselecting a Plot
From Plot Setup, highlight the plot and press †
to toggle it on or off. If a stat plot is
selected, it remains selected when you:
• Change the graph mode. (Stat plots are not graphed in 3D mode.)
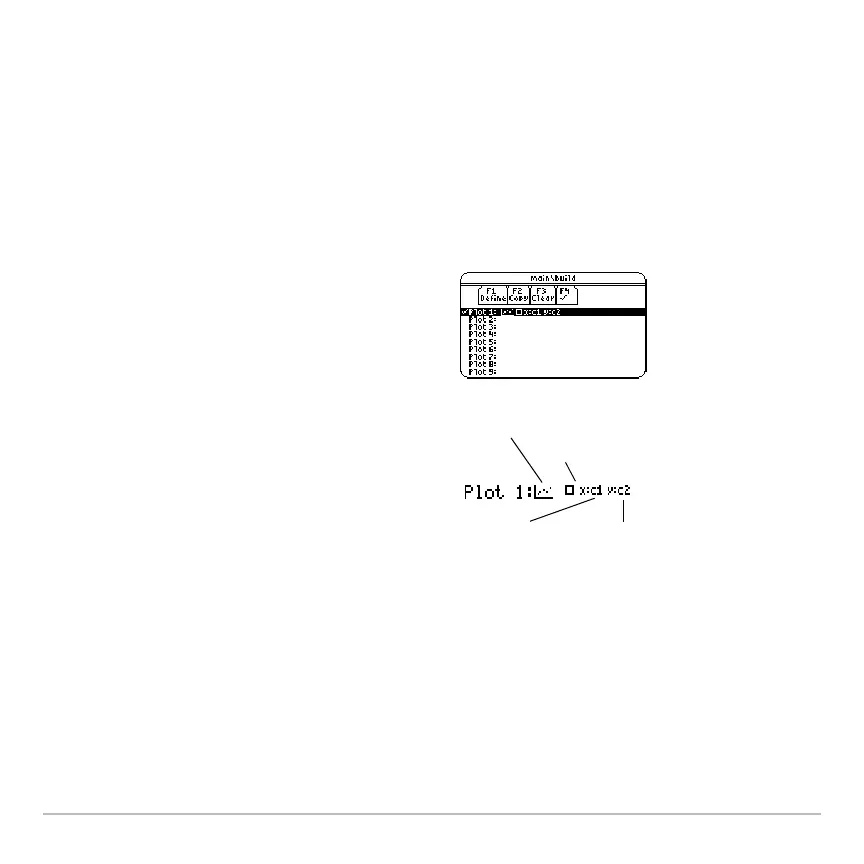
The
Plot Setup screen is redisplayed.
The plot you just defined is automatically
selected for graphing.
Notice the shorthand definition for the
plot.
Plot Type = Scatter
Mark = Box
y = c2 x = c1

 Loading...


