Activities 728
Method 1: Graph Plot
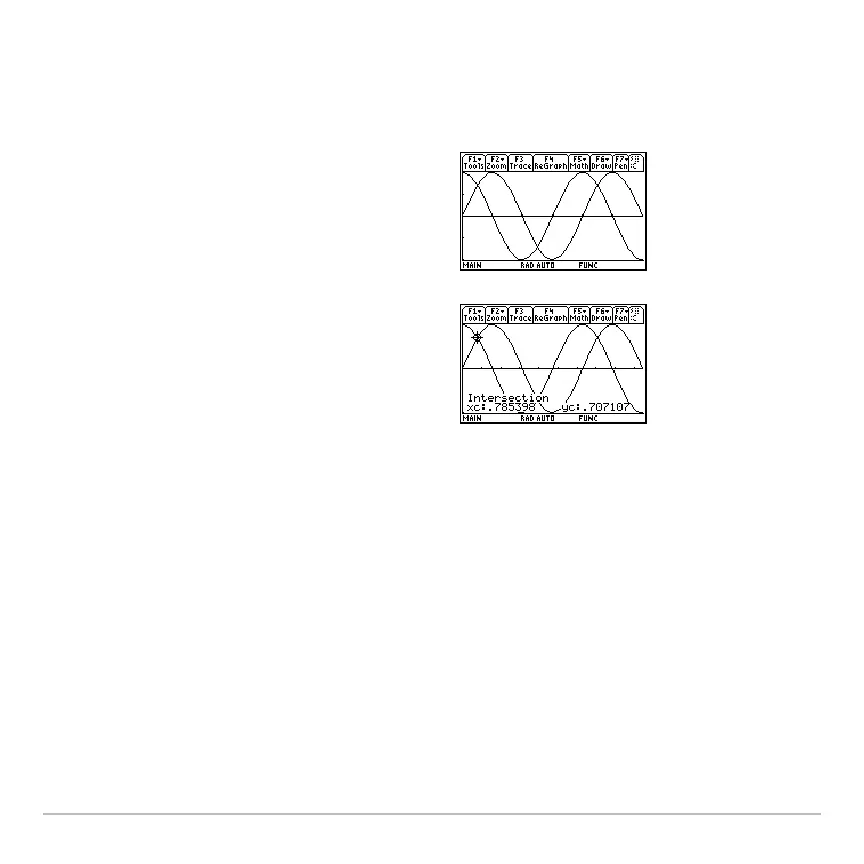
Perform the following steps to observe where the graphs of the functions
y1(x)=cos(x)
and
y2(x)=sin(x) intersect.
1. In the
Y= Editor, set y1(x)=cos(x) and
2(x)=sin(x).
2. In the
Window Editor, set xmin=0 and
xmax=3p.
3. Press „ and select
A:ZoomFit.
4. Find the intersection point of the two
functions.
Note: Press ‡ and select 5:Intersection.
Respond to the screen prompts to select
the two curves, and the lower and upper
bounds for intersection
A.
5. Note the
x and y coordinates. (Repeat
steps 4 and 5 to find the other
intersections.)

 Loading...


